OPEN-SOURCE SCRIPT
RSI - ARIEIV
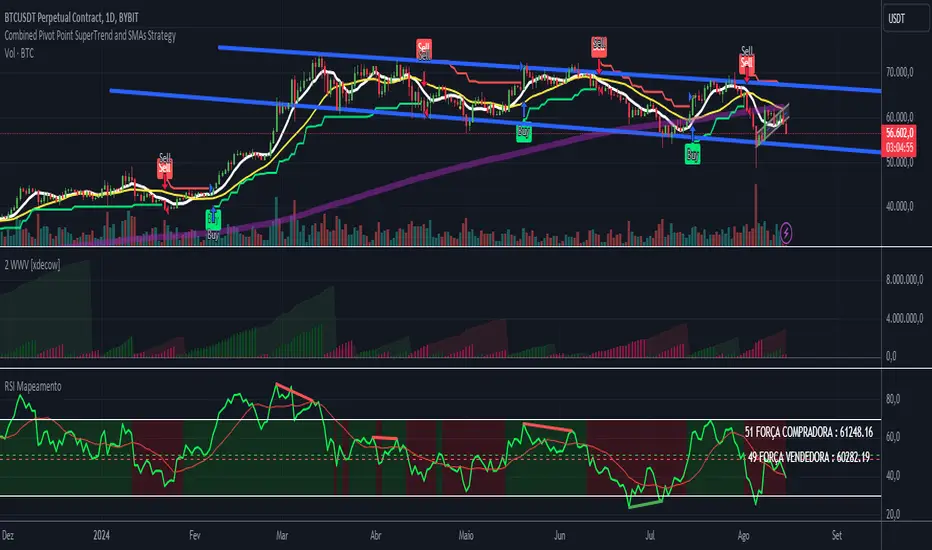
he RSI MAPPING - ARIEIV is a powerful technical indicator based on the Relative Strength Index (RSI) combined with moving averages and divergence detection. This indicator is designed to provide a clear view of overbought and oversold conditions, as well as identifying potential reversals and signals for market entries and exits.
Key Features:
Customizable RSI:
The indicator offers flexibility in adjusting the RSI length and data source (closing price, open price, etc.).
The overbought and oversold lines can be customized, allowing the RSI to signal critical market zones according to the trader’s strategy.
RSI-Based Moving Averages (MA):
Users can enable a moving average based on the RSI with support for multiple types such as SMA, EMA, WMA, VWMA, and SMMA (RMA).
For those who prefer Bollinger Bands, there’s an option to use the moving average with standard deviation to detect market volatility.
Divergence Detection:
Detects both regular and hidden divergences (bullish and bearish) between price and RSI, which can indicate potential market reversals.
These divergences can be customized with specific colors for easy identification on the chart, allowing traders to quickly spot significant market shifts.
Zone Mapping:
The script maps zones of buying and selling strength, filling the areas between the overbought and oversold levels with specific colors, highlighting when the market is in extreme conditions.
Strength Tables:
At the end of each session, a table appears on the right side of the chart, displaying the "Buying Strength" and "Selling Strength" based on calculated RSI levels. This allows for quick analysis of the dominant pressure in the market.
Flexible Settings:
Many customization options are available, from adjusting the number of decimal places to the choice of colors and the ability to toggle elements on or off within the chart.
오픈 소스 스크립트
트레이딩뷰의 진정한 정신에 따라, 이 스크립트의 작성자는 이를 오픈소스로 공개하여 트레이더들이 기능을 검토하고 검증할 수 있도록 했습니다. 작성자에게 찬사를 보냅니다! 이 코드는 무료로 사용할 수 있지만, 코드를 재게시하는 경우 하우스 룰이 적용된다는 점을 기억하세요.
면책사항
해당 정보와 게시물은 금융, 투자, 트레이딩 또는 기타 유형의 조언이나 권장 사항으로 간주되지 않으며, 트레이딩뷰에서 제공하거나 보증하는 것이 아닙니다. 자세한 내용은 이용 약관을 참조하세요.
오픈 소스 스크립트
트레이딩뷰의 진정한 정신에 따라, 이 스크립트의 작성자는 이를 오픈소스로 공개하여 트레이더들이 기능을 검토하고 검증할 수 있도록 했습니다. 작성자에게 찬사를 보냅니다! 이 코드는 무료로 사용할 수 있지만, 코드를 재게시하는 경우 하우스 룰이 적용된다는 점을 기억하세요.
면책사항
해당 정보와 게시물은 금융, 투자, 트레이딩 또는 기타 유형의 조언이나 권장 사항으로 간주되지 않으며, 트레이딩뷰에서 제공하거나 보증하는 것이 아닙니다. 자세한 내용은 이용 약관을 참조하세요.