OPEN-SOURCE SCRIPT
Multi Asset + Correlation Overlay
From time to time, you may want to overlay multiple assets on the same chart instead of using multi-chart views. This can be a much cleaner way of viewing and comparing multiple assets. There is some functionality built into TradingView that lets you do this to a certain extent, but I wanted additional options, correlation labeling and ways to adjust the overlay location. So, today I am releasing to the community my Multi-Asset + Correlation Overlay script / indicator.
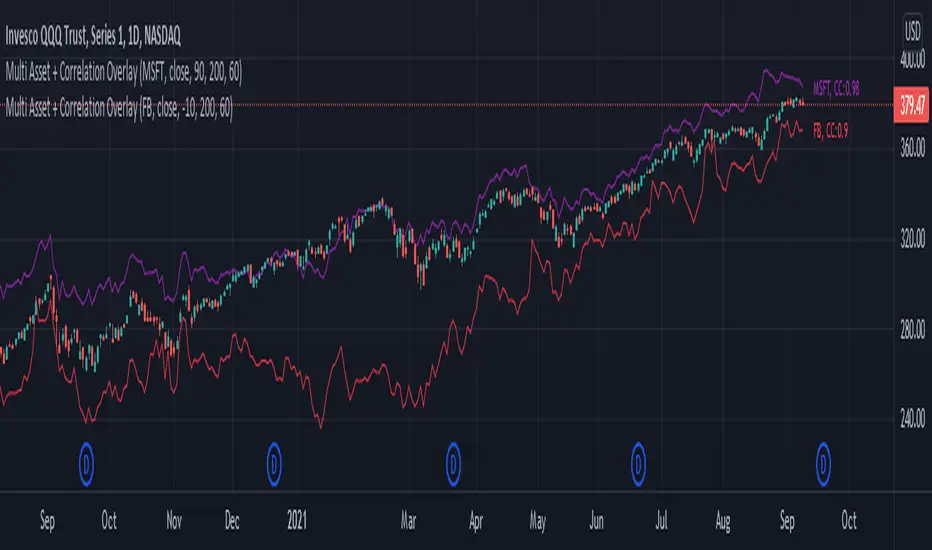
What is does: This script allows you to overlay the price of any ticker onto your chart. It also labels the line with the ticker name, and calculates / labels the correlation coefficient of your newly overlayed asset.
How to use it: Add the indicator to your chart. Then, go into the indicator settings to set the ticker of the asset you want to pull in along with how you want to "offset" it. Your 2 tickers may not be priced near each-other, so the offset setting allows you to pull the ticker you added up/down to better visually align with your chart's price range/layout. For instance, if the asset you added is priced $400 higher than the underlying chart price, you may want to set the offset to -400.
If you would like to add multiple tickers and multiple overlays, you can do that by just adding the indicator to your chart more than once. The color is adjustable, and the ticker of the asset will print to the right of the line representing the asset price. The script also calculates the correlation coefficient between the ticker overlay and the underlying chart asset. The correlation coefficient prints to the right of the ticker.
오픈 소스 스크립트
트레이딩뷰의 진정한 정신에 따라, 이 스크립트의 작성자는 이를 오픈소스로 공개하여 트레이더들이 기능을 검토하고 검증할 수 있도록 했습니다. 작성자에게 찬사를 보냅니다! 이 코드는 무료로 사용할 수 있지만, 코드를 재게시하는 경우 하우스 룰이 적용된다는 점을 기억하세요.
Want to build custom alerts and custom strategies? Interested in automated trading?
Hire me to code or automate your trading strategy, or schedule a free consultation at:
TradeAutomation.net
Hire me to code or automate your trading strategy, or schedule a free consultation at:
TradeAutomation.net
면책사항
해당 정보와 게시물은 금융, 투자, 트레이딩 또는 기타 유형의 조언이나 권장 사항으로 간주되지 않으며, 트레이딩뷰에서 제공하거나 보증하는 것이 아닙니다. 자세한 내용은 이용 약관을 참조하세요.