PROTECTED SOURCE SCRIPT
업데이트됨 📊 Monitor F&M - RLYON
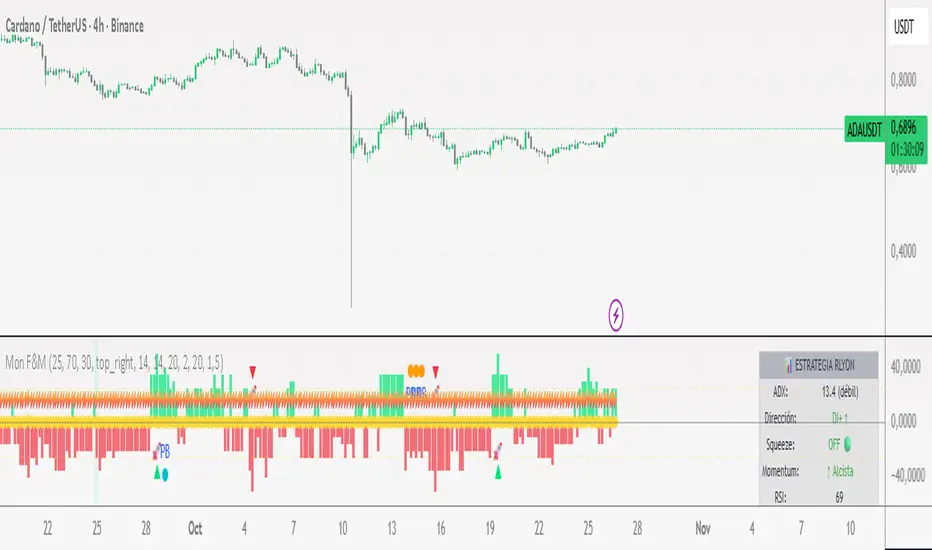
SCRIPT OBJECTIVE
It's a confluence system that combines four key indicators to identify high-probability trading setups. It basically tells you when and where to enter the market with greater confidence.
🔧 THE 4 BASE INDICATORS
1. ADX (Average Directional Index)
What it measures: The strength of the trend (not the direction)
How to use it:
ADX ≥ 25 = STRONG trend ✅
ADX < 25 = Weak or sideways trend
What it does: Filters trades. You only look for entries when there is real strength in the market.
2. DI+ and DI- (Directional Indicators)
What it measures: The direction of the trend.
How to use it:
DI+ > DI- = Bullish trend 📈
DI- > DI+ = Bearish trend 📉
What it does: Defines whether you are looking for buys or sells.
3. TTM Squeeze (Bollinger Bands + Keltner Channels)
What it measures: Volatility compression and explosion.
States:
Squeeze ON 🔴: Volatility compressed (like a tightened spring).
Squeeze OFF 🟢: Volatility released (the spring is released = strong movement).
Transition 🔵: Changing state.
Momentum: The green/red histogram shows the direction of the movement.
Green rising = Strong bullish trend.
Red falling = Strong bearish trend.
4. RSI (Relative Strength Index)
What it measures: Whether the price is overbought or oversold.
Zones:
RSI > 70 = Overbought ⚠️ (be careful with purchases)
RSI < 30 = Oversold ✅ (bullish opportunity zone)
RSI 40-60 = Neutral zone/ideal for pullbacks
🎯 THE 2 MAIN STRATEGIES
STRATEGY 1: MOMENTUM (The strongest) 🚀
BUY setup:
✅ Squeeze released (changed from ON to OFF)
✅ Momentum green AND growing
✅ ADX ≥ 25 (strong trend)
✅ RSI not overbought (< 70)
SELL setup:
✅ Squeeze released (changed from ON to OFF)
✅ Momentum red AND Decreasing
✅ ADX ≥ 25 (strong trend)
✅ RSI not oversold (> 30)
When to trade: When you see the triangle 🚀 on the chart
STRATEGY 2: PULLBACK (Established trend) 📈📉
BUY setup:
✅ DI+ > DI- (established uptrend)
✅ ADX ≥ 25 (strong trend)
✅ RSI between 40-55 (healthy pullback)
✅ Momentum starting to turn upward
SELL setup:
✅ DI- > DI+ (established downtrend)
✅ ADX ≥ 25 (strong trend)
✅ RSI between 45-60 (healthy pullback)
✅ Momentum starting to turn downward
When to trade: When you see the "PB" circle in the graph
릴리즈 노트
mejorada la calidad del panel informativo보호된 스크립트입니다
이 스크립트는 비공개 소스로 게시됩니다. 하지만 이를 자유롭게 제한 없이 사용할 수 있습니다 – 자세한 내용은 여기에서 확인하세요.
면책사항
해당 정보와 게시물은 금융, 투자, 트레이딩 또는 기타 유형의 조언이나 권장 사항으로 간주되지 않으며, 트레이딩뷰에서 제공하거나 보증하는 것이 아닙니다. 자세한 내용은 이용 약관을 참조하세요.
면책사항
해당 정보와 게시물은 금융, 투자, 트레이딩 또는 기타 유형의 조언이나 권장 사항으로 간주되지 않으며, 트레이딩뷰에서 제공하거나 보증하는 것이 아닙니다. 자세한 내용은 이용 약관을 참조하세요.