PROTECTED SOURCE SCRIPT
Overnight Gap Detector
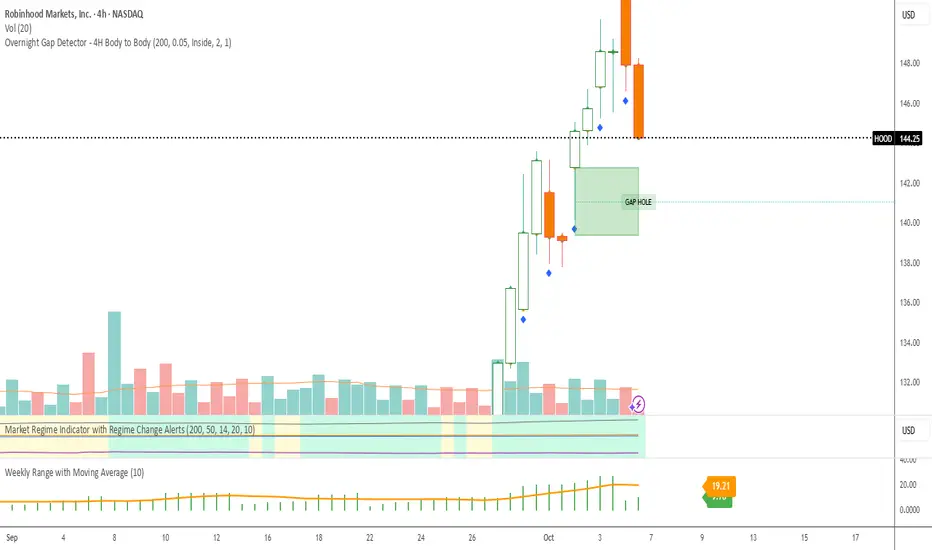
Overnight Gap Detector - 4H Body to Body
What it detects:
The indicator finds overnight gaps - i.e., gaps between trading days based on 4-hour (4H) candle data.
Gap Definition (Wick to Wick):
Gap UP: When yesterday's 4H candle's highest point (high) is BELOW today's 4H candle's lowest point (low) - there's "air" between them
Gap DOWN: When yesterday's 4H candle's lowest point (low) is ABOVE today's 4H candle's highest point (high)
Rectangle Drawing (Body to Body):
Although the gap is detected via wicks, the rectangle is only drawn between the bodies:
Gap UP: Draws from today's open to yesterday's body top (max of open/close)
Gap DOWN: Draws from yesterday's body bottom (min of open/close) to today's open
This means the rectangle does NOT cover the wicks, only the actual gap between bodies.
Midline:
50% line between top and bottom of the gap rectangle
Continues to the right along with the rectangle
Stops when the gap is filled
Gap Filled:
A gap is marked as "filled" when:
Gap UP: Price's close goes DOWN and reaches yesterday's body top
Gap DOWN: Price's close goes UP and reaches yesterday's body bottom
Important: Only close body counts, not wicks!
Visual Elements:
Green box: Gap Up (upward gap)
Red box: Gap Down (downward gap)
Yellow box: Filled gap
Labels: "GAP HOLE" when active, "FILLED gap" when filled
Midline: Dotted line through the middle of the gap
Features:
✅ Works on all timeframes (5min, 15min, 1H, 2H, 4H, etc.) - always uses 4H data
✅ Rectangles expand bar by bar until filled
✅ Customizable colors for gaps, borders, midlines, and labels
✅ Label position (inside or outside box)
✅ Toggle to show/hide labels and midlines
✅ Minimum gap size filter (%)
보호된 스크립트입니다
이 스크립트는 비공개 소스로 게시됩니다. 하지만 이를 자유롭게 제한 없이 사용할 수 있습니다 – 자세한 내용은 여기에서 확인하세요.
면책사항
해당 정보와 게시물은 금융, 투자, 트레이딩 또는 기타 유형의 조언이나 권장 사항으로 간주되지 않으며, 트레이딩뷰에서 제공하거나 보증하는 것이 아닙니다. 자세한 내용은 이용 약관을 참조하세요.
면책사항
해당 정보와 게시물은 금융, 투자, 트레이딩 또는 기타 유형의 조언이나 권장 사항으로 간주되지 않으며, 트레이딩뷰에서 제공하거나 보증하는 것이 아닙니다. 자세한 내용은 이용 약관을 참조하세요.