OPEN-SOURCE SCRIPT
업데이트됨 Visible Range Streaks of Unbroken Prior Highs/Lows [vnhilton]
(OVERVIEW)
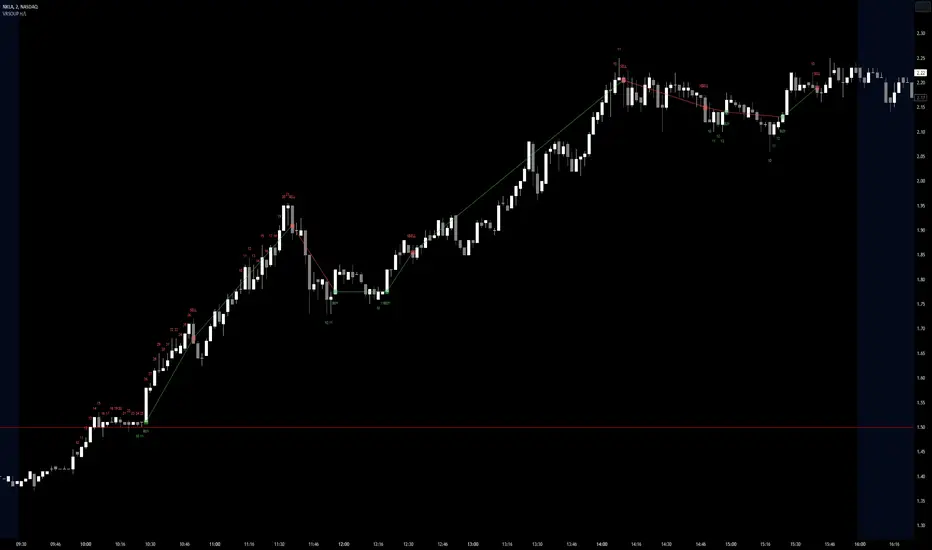
This indicator keeps track of the number of unbroken prior highs/lows (unbroken being no price closes above/below the prior high/low). Great for entries and take profits. The indicator calculates on visible bars for convenience when looking back into the history without having to use bar replay, which those on the TradingView free plan cannot use intraday bar replay, so the visible range is a perfect work-around. The 2 minute chart above shows NKLA on Thursday 13th July, 2023, with a significant level of $1.5 leading to a breakout. Streaks lower than 10 were hidden in the chart.
(FEATURES)
- Custom minimum streak size to start displaying plots (the smaller the size the more signals)
- Ability to show/hide numbers (that keep count of unbroken streaks), text signals (for when a streak is broken), break shapes (where the prior high/low was broken), and Zig Zag (lines between break shapes)
- Customisable Zig Zag line width, style, and colours (1 colour for a positive gradient line, and another for a negative gradient line)
- Customisable text signal text
- Customisable numbers, text signal, break shape, number label & text signal label colours
- Customisable number label, text signal label and break shape styles and sizes (number and text signal label share the same size)
This indicator keeps track of the number of unbroken prior highs/lows (unbroken being no price closes above/below the prior high/low). Great for entries and take profits. The indicator calculates on visible bars for convenience when looking back into the history without having to use bar replay, which those on the TradingView free plan cannot use intraday bar replay, so the visible range is a perfect work-around. The 2 minute chart above shows
(FEATURES)
- Custom minimum streak size to start displaying plots (the smaller the size the more signals)
- Ability to show/hide numbers (that keep count of unbroken streaks), text signals (for when a streak is broken), break shapes (where the prior high/low was broken), and Zig Zag (lines between break shapes)
- Customisable Zig Zag line width, style, and colours (1 colour for a positive gradient line, and another for a negative gradient line)
- Customisable text signal text
- Customisable numbers, text signal, break shape, number label & text signal label colours
- Customisable number label, text signal label and break shape styles and sizes (number and text signal label share the same size)
릴리즈 노트
- Added toggle to count wicks as streak breaks. This has the benefit of not exiting or entering too late/far, at the expense of streaks ending earlier and more wick fake-outs.Indicator with wicks counted as streak breaks. Example can be seen in the orange circle drawing.
오픈 소스 스크립트
트레이딩뷰의 진정한 정신에 따라, 이 스크립트의 작성자는 이를 오픈소스로 공개하여 트레이더들이 기능을 검토하고 검증할 수 있도록 했습니다. 작성자에게 찬사를 보냅니다! 이 코드는 무료로 사용할 수 있지만, 코드를 재게시하는 경우 하우스 룰이 적용된다는 점을 기억하세요.
면책사항
해당 정보와 게시물은 금융, 투자, 트레이딩 또는 기타 유형의 조언이나 권장 사항으로 간주되지 않으며, 트레이딩뷰에서 제공하거나 보증하는 것이 아닙니다. 자세한 내용은 이용 약관을 참조하세요.
오픈 소스 스크립트
트레이딩뷰의 진정한 정신에 따라, 이 스크립트의 작성자는 이를 오픈소스로 공개하여 트레이더들이 기능을 검토하고 검증할 수 있도록 했습니다. 작성자에게 찬사를 보냅니다! 이 코드는 무료로 사용할 수 있지만, 코드를 재게시하는 경우 하우스 룰이 적용된다는 점을 기억하세요.
면책사항
해당 정보와 게시물은 금융, 투자, 트레이딩 또는 기타 유형의 조언이나 권장 사항으로 간주되지 않으며, 트레이딩뷰에서 제공하거나 보증하는 것이 아닙니다. 자세한 내용은 이용 약관을 참조하세요.