OPEN-SOURCE SCRIPT
업데이트됨 EGARCH Volatility Estimator
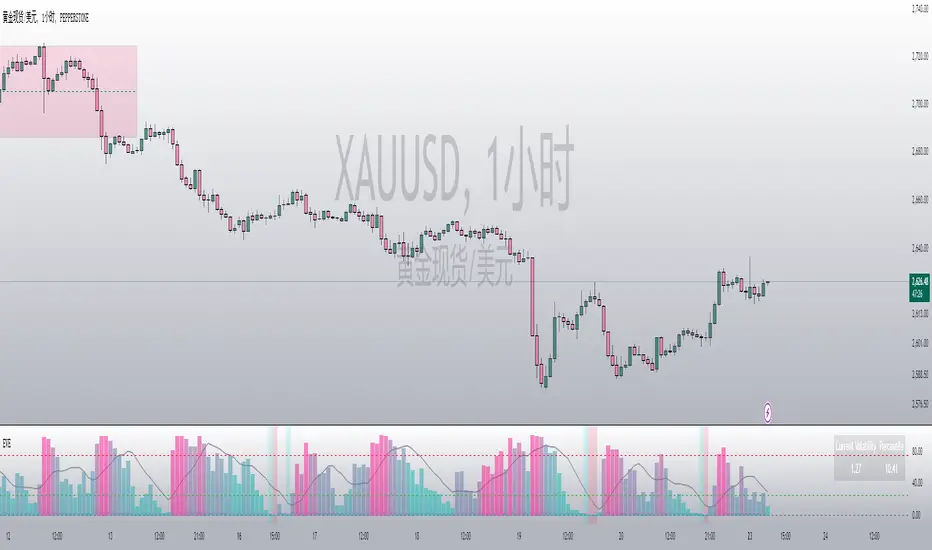
EGARCH Volatility Estimator (EVE)
Overview:
The EGARCH Volatility Estimator (EVE) is a Pine Script indicator designed to quantify market volatility using the Exponential Generalized Autoregressive Conditional Heteroskedasticity (EGARCH) model. This model captures both symmetric and asymmetric volatility dynamics and provides a robust tool for analyzing market risk and trends.
Key Features:
Core EGARCH Formula:
ln(σ t 2 )=ω+α(∣ϵ t−1 ∣+γ⋅ϵ t−1 )+β⋅ln(σ t−1 2 )
ω (Omega): Captures long-term baseline volatility.
α (Alpha): Measures sensitivity to recent shocks.
γ (Gamma): Incorporates asymmetric effects (e.g., higher volatility during market drops).
β (Beta): Reflects the persistence of historical volatility.
The formula computes log-volatility, which is then converted to actual volatility for interpretation.
Standardized Returns:
The script calculates daily log-returns and standardizes them to measure deviations from expected price changes.
Percentile-Based Volatility Analysis:
Tracks the percentile rank of current volatility over a historical lookback period.
Highlights high, medium, or low volatility zones using dynamic background colors.
Dynamic Normalization:
Maps volatility into a normalized range ([0,1]) for better visual interpretation.
Uses color gradients (green to red) to reflect changing volatility levels.
SMA Integration:
Adds a Simple Moving Average (SMA) of either EGARCH volatility or its percentile for trend analysis.
Interactive Display:
Displays current volatility and its percentile rank in a table for quick reference.
Includes high (75%) and low (25%) volatility threshold lines for actionable insights.
Applications:
Market Risk Assessment: Evaluate current and historical volatility to assess market risk levels.
Quantitative Strategy Development: Incorporate volatility dynamics into trading strategies, particularly for options or risk-managed portfolios.
Trend and Momentum Analysis: Use normalized or smoothed volatility trends to identify potential reversals or breakouts.
Asymmetric Volatility Detection: Highlight periods where downside or upside volatility dominates.
Visualization Enhancements:
Dynamic colors and thresholds make it intuitive to interpret market conditions.
Percentile views provide relative volatility context for historical comparison.
This indicator is a versatile tool for traders and analysts seeking deeper insights into market behavior, particularly in volatility-driven trading strategies.
릴리즈 노트
Fixed expression errors and chart display issues,By default, SMA is displayed in percentage오픈 소스 스크립트
트레이딩뷰의 진정한 정신에 따라, 이 스크립트의 작성자는 이를 오픈소스로 공개하여 트레이더들이 기능을 검토하고 검증할 수 있도록 했습니다. 작성자에게 찬사를 보냅니다! 이 코드는 무료로 사용할 수 있지만, 코드를 재게시하는 경우 하우스 룰이 적용된다는 점을 기억하세요.
면책사항
해당 정보와 게시물은 금융, 투자, 트레이딩 또는 기타 유형의 조언이나 권장 사항으로 간주되지 않으며, 트레이딩뷰에서 제공하거나 보증하는 것이 아닙니다. 자세한 내용은 이용 약관을 참조하세요.
오픈 소스 스크립트
트레이딩뷰의 진정한 정신에 따라, 이 스크립트의 작성자는 이를 오픈소스로 공개하여 트레이더들이 기능을 검토하고 검증할 수 있도록 했습니다. 작성자에게 찬사를 보냅니다! 이 코드는 무료로 사용할 수 있지만, 코드를 재게시하는 경우 하우스 룰이 적용된다는 점을 기억하세요.
면책사항
해당 정보와 게시물은 금융, 투자, 트레이딩 또는 기타 유형의 조언이나 권장 사항으로 간주되지 않으며, 트레이딩뷰에서 제공하거나 보증하는 것이 아닙니다. 자세한 내용은 이용 약관을 참조하세요.