OPEN-SOURCE SCRIPT
업데이트됨 Comparison Candles

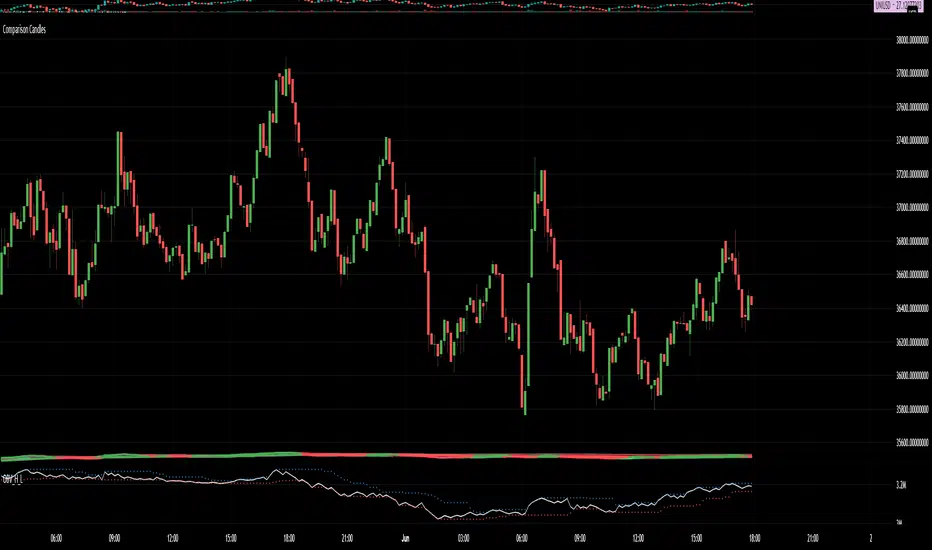
Pretty simple. Pick a security and it plots candlesticks to compare it to the current chart.
So if looking at CAKEBTC and comparing to UNIBTC, you get CAKEUNI.
Beats the hell out of plotting multiple plots and trying to compare them. No longer is your scale based on where your zoom starts.
Also allows you to draw oscillators from the plots.
Shown is my Uber RSI plotted on the comparison candles close on CAKEUNI (binance both).
No longer struggle to chart against messed up uniswap charts because your exchange of choice isn't listed on tradingview.
No longer struggle to chart ethereum pairs that don't exist on any of the exchanges supported officially by Tradingview charting.
"You just win."
릴리즈 노트
Added more plots to draw indicators from. They are "display on" but transparent.Includes the common HL2, HLC3, OHLC4, but also OC2 and weighted HLC3s for extra measure.
릴리즈 노트
Fixed the color plot... was based on the original chart instead of the comparison. Woops!오픈 소스 스크립트
트레이딩뷰의 진정한 정신에 따라, 이 스크립트의 작성자는 이를 오픈소스로 공개하여 트레이더들이 기능을 검토하고 검증할 수 있도록 했습니다. 작성자에게 찬사를 보냅니다! 이 코드는 무료로 사용할 수 있지만, 코드를 재게시하는 경우 하우스 룰이 적용된다는 점을 기억하세요.
면책사항
해당 정보와 게시물은 금융, 투자, 트레이딩 또는 기타 유형의 조언이나 권장 사항으로 간주되지 않으며, 트레이딩뷰에서 제공하거나 보증하는 것이 아닙니다. 자세한 내용은 이용 약관을 참조하세요.
오픈 소스 스크립트
트레이딩뷰의 진정한 정신에 따라, 이 스크립트의 작성자는 이를 오픈소스로 공개하여 트레이더들이 기능을 검토하고 검증할 수 있도록 했습니다. 작성자에게 찬사를 보냅니다! 이 코드는 무료로 사용할 수 있지만, 코드를 재게시하는 경우 하우스 룰이 적용된다는 점을 기억하세요.
면책사항
해당 정보와 게시물은 금융, 투자, 트레이딩 또는 기타 유형의 조언이나 권장 사항으로 간주되지 않으며, 트레이딩뷰에서 제공하거나 보증하는 것이 아닙니다. 자세한 내용은 이용 약관을 참조하세요.