PROTECTED SOURCE SCRIPT
업데이트됨 Buy/Sell Volume Details
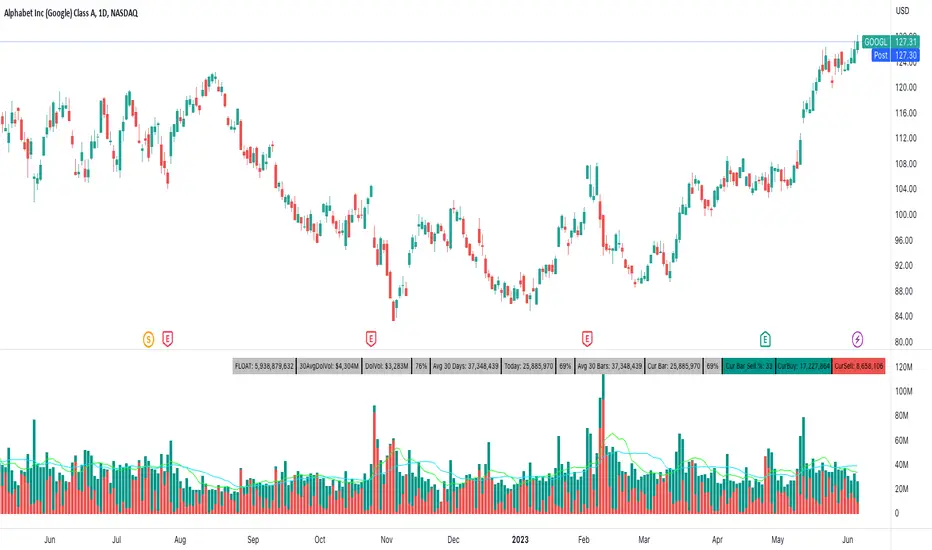
This attempts to color buy and sell volume of each bar.
In addition to coloring the bars, the table shows average volumes for the past 30 days, current volume for the day, current bar volume, the float of the ticker, and dollar volume for the day and average 30 days. You can also plot a fast and slow moving average of volume.
In addition to coloring the bars, the table shows average volumes for the past 30 days, current volume for the day, current bar volume, the float of the ticker, and dollar volume for the day and average 30 days. You can also plot a fast and slow moving average of volume.
릴리즈 노트
- Enhanced the code to be. more efficient when calculating the averages
- Added the ability to select the look back period. The default is 30 days but you can now change how far back you want the averages to take into account.
릴리즈 노트
- Added buy and sell volume cells that can be toggled on/off
보호된 스크립트입니다
이 스크립트는 비공개 소스로 게시됩니다. 하지만 이를 자유롭게 제한 없이 사용할 수 있습니다 – 자세한 내용은 여기에서 확인하세요.
면책사항
해당 정보와 게시물은 금융, 투자, 트레이딩 또는 기타 유형의 조언이나 권장 사항으로 간주되지 않으며, 트레이딩뷰에서 제공하거나 보증하는 것이 아닙니다. 자세한 내용은 이용 약관을 참조하세요.
면책사항
해당 정보와 게시물은 금융, 투자, 트레이딩 또는 기타 유형의 조언이나 권장 사항으로 간주되지 않으며, 트레이딩뷰에서 제공하거나 보증하는 것이 아닙니다. 자세한 내용은 이용 약관을 참조하세요.