OPEN-SOURCE SCRIPT
Multiasset MVRVZ - MVRVZ for Multiple Crypto Assets [Da_Prof]
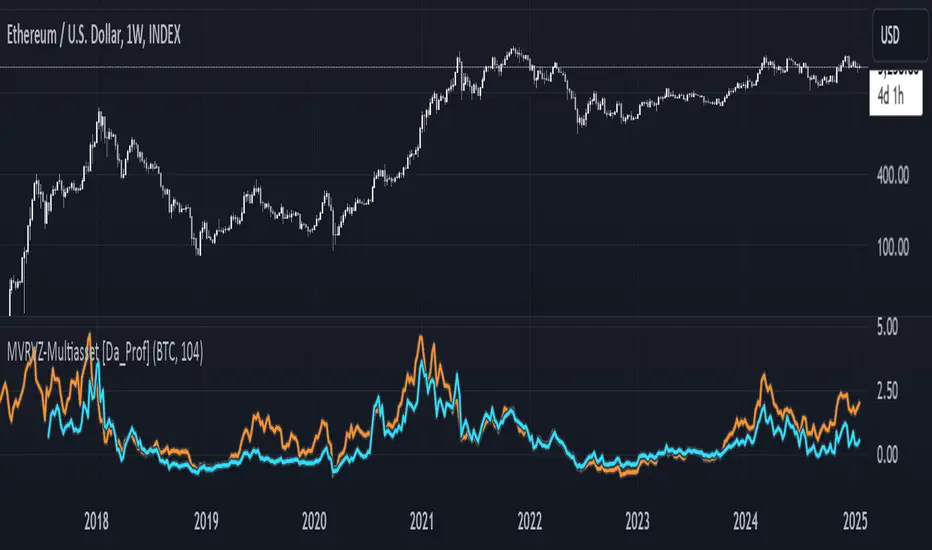
This indicator shows the Market Value-Realized Value Z-score (MVRVZ) for Multiple Assets. The MVRV-Z score measures the value of a crypto asset by comparing its market cap to the realized value and dividing by the standard deviation of the market cap (market cap – realized cap) / stdev(market cap) to get a z-score. When the market value is significantly higher than the realized value, the asset may be considered "overvalued". Conversely, market values below the realized value may indicate the asset is "undervalued". For some assets (e.g., BTC) historically high values have generally signaled price tops and historically low values have signaled bottoms.
The indicator displays two lines: 1) the MVRV-Z of the current chart symbol if the data is available through Coin Metrics (this is displayed in light blue), and 2) the MVRV-Z of the symbol selected from the dropdown (displayed in orange). The MVRV-Z of BTC is the default selected orange line. The example chart shows ETH's MVRV-Z in blue and
  BTC's MVRV-Z in orange.
The MVRV-Z in this indicator is calculated on the weekly and will display consistently on lower timeframes. Some MVRV-Z indicators calculate this value from collection of all data from the beginning of the chart on the timeframe of the chart. This creates inconsistency in the standard deviation calculation and ultimately the z-score calculation when moving between time frames. This indicator calculates MVRV-Z based on the set number of weeks prior from the source data directly (default is two years worth of weekly data). This allows consistent MVRV-Z values on weekly and lower timeframes.
The indicator displays two lines: 1) the MVRV-Z of the current chart symbol if the data is available through Coin Metrics (this is displayed in light blue), and 2) the MVRV-Z of the symbol selected from the dropdown (displayed in orange). The MVRV-Z of BTC is the default selected orange line. The example chart shows
The MVRV-Z in this indicator is calculated on the weekly and will display consistently on lower timeframes. Some MVRV-Z indicators calculate this value from collection of all data from the beginning of the chart on the timeframe of the chart. This creates inconsistency in the standard deviation calculation and ultimately the z-score calculation when moving between time frames. This indicator calculates MVRV-Z based on the set number of weeks prior from the source data directly (default is two years worth of weekly data). This allows consistent MVRV-Z values on weekly and lower timeframes.
오픈 소스 스크립트
트레이딩뷰의 진정한 정신에 따라, 이 스크립트의 작성자는 이를 오픈소스로 공개하여 트레이더들이 기능을 검토하고 검증할 수 있도록 했습니다. 작성자에게 찬사를 보냅니다! 이 코드는 무료로 사용할 수 있지만, 코드를 재게시하는 경우 하우스 룰이 적용된다는 점을 기억하세요.
면책사항
해당 정보와 게시물은 금융, 투자, 트레이딩 또는 기타 유형의 조언이나 권장 사항으로 간주되지 않으며, 트레이딩뷰에서 제공하거나 보증하는 것이 아닙니다. 자세한 내용은 이용 약관을 참조하세요.
오픈 소스 스크립트
트레이딩뷰의 진정한 정신에 따라, 이 스크립트의 작성자는 이를 오픈소스로 공개하여 트레이더들이 기능을 검토하고 검증할 수 있도록 했습니다. 작성자에게 찬사를 보냅니다! 이 코드는 무료로 사용할 수 있지만, 코드를 재게시하는 경우 하우스 룰이 적용된다는 점을 기억하세요.
면책사항
해당 정보와 게시물은 금융, 투자, 트레이딩 또는 기타 유형의 조언이나 권장 사항으로 간주되지 않으며, 트레이딩뷰에서 제공하거나 보증하는 것이 아닙니다. 자세한 내용은 이용 약관을 참조하세요.