OPEN-SOURCE SCRIPT
Stocks Advance/Decline Histogram
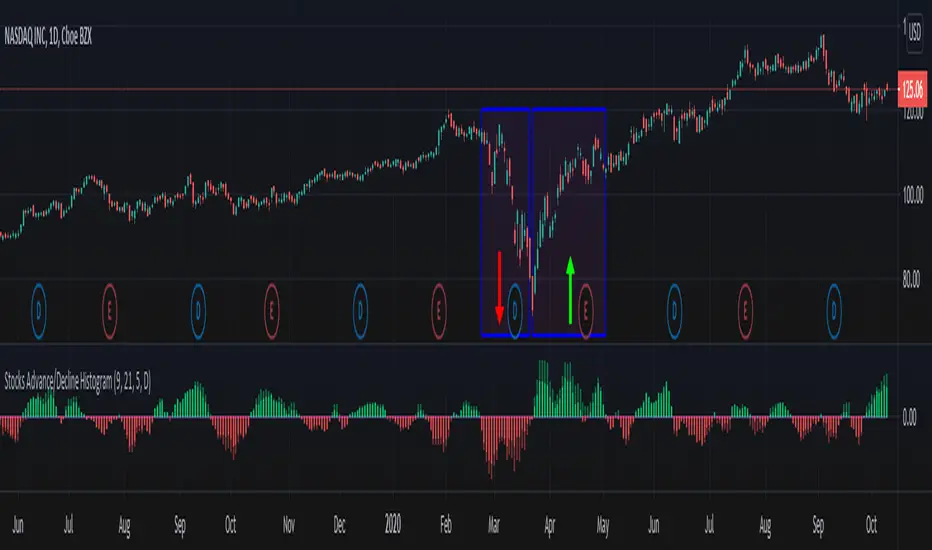
Stocks Advance/Decline Histogram indicator, which I call ADH is my own implementation that plots an histogram of the difference between the number of advancing and declining stocks on a daily basis (or higher time frame) for the NASDAQ and NYSE.
How to use it?
Green: More NYSE stocks are advancing than declining.
Red: More NYSE stocks are declining than advancing.
Light Green: More NASDAQ stocks are advancing than declining.
Light Red: More NASDAQ stocks are declining than advancing.
Note: Advance/Decline data is based on daily or higher time frames.
오픈 소스 스크립트
트레이딩뷰의 진정한 정신에 따라, 이 스크립트의 작성자는 이를 오픈소스로 공개하여 트레이더들이 기능을 검토하고 검증할 수 있도록 했습니다. 작성자에게 찬사를 보냅니다! 이 코드는 무료로 사용할 수 있지만, 코드를 재게시하는 경우 하우스 룰이 적용된다는 점을 기억하세요.
Appreciation of my work: paypal.me/dman103
All Premium indicators: algo.win
LIVE Stream - Pivot Points Algo: youtube.com/channel/UCFyqab-i0xb2jf-c18ufH0A/live
All Premium indicators: algo.win
LIVE Stream - Pivot Points Algo: youtube.com/channel/UCFyqab-i0xb2jf-c18ufH0A/live
면책사항
해당 정보와 게시물은 금융, 투자, 트레이딩 또는 기타 유형의 조언이나 권장 사항으로 간주되지 않으며, 트레이딩뷰에서 제공하거나 보증하는 것이 아닙니다. 자세한 내용은 이용 약관을 참조하세요.