OPEN-SOURCE SCRIPT
업데이트됨 Break-Even Line - JD
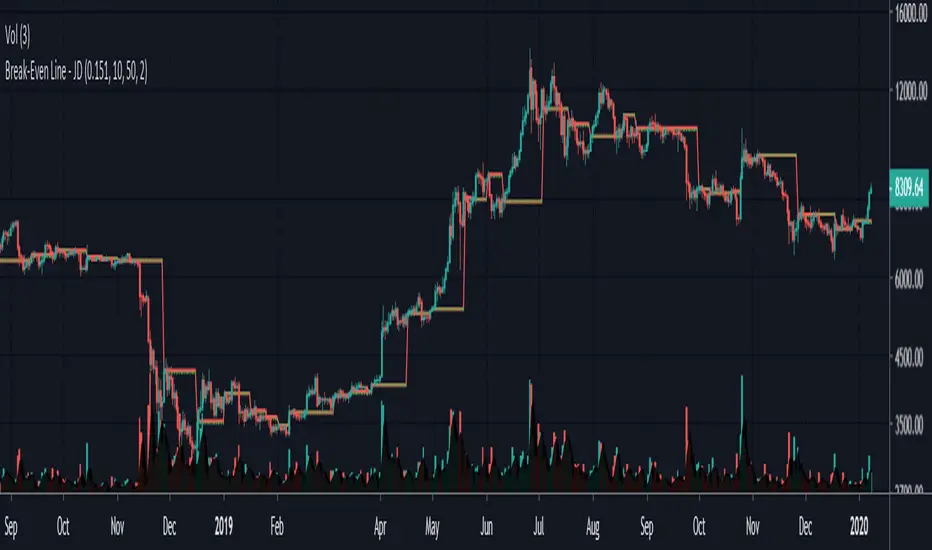
This gives you a simple visual representation of fees implications.
This indicator can give you an insight of what timeframes are worth trading, and at what timeframes your profit will be "eaten by fees"
The indicator shows, how far price has to move from the last swing points (if you entered there) to break-even after fees
As long as you're 'in the red' you P/L after fees will be negative!!
The fees are added once for entry and once for exit, so you have to enter the fees per transaction
(eg in BitSeven this is 0.075%/trans for BTC and 0.151%/trans for ETH)
Of course this can be used for any market.
JD.
#NotTradingAdvice #DYOR
I build thes indicators for myself and provide them open source, to use for free to use and improve upon,
as I believe the best way to learn is toghether.
릴리즈 노트
Changed the entry value to the "close" at the time of the "pivot signal" instead of the pivot value itself, to have a more realistic entry and break-even point .JD.
릴리즈 노트
update to v4.오픈 소스 스크립트
트레이딩뷰의 진정한 정신에 따라, 이 스크립트의 작성자는 이를 오픈소스로 공개하여 트레이더들이 기능을 검토하고 검증할 수 있도록 했습니다. 작성자에게 찬사를 보냅니다! 이 코드는 무료로 사용할 수 있지만, 코드를 재게시하는 경우 하우스 룰이 적용된다는 점을 기억하세요.
Disclaimer.
I AM NOT A FINANCIAL ADVISOR.
THESE IDEAS ARE NOT ADVICE AND ARE FOR EDUCATION PURPOSES ONLY.
ALWAYS DO YOUR OWN RESEARCH!
JD.
You can contact me for info/access in PM or on Telegram: @jduyck
PLS, DON'T ASK FOR ACCESS IN THE COMMENT SECTION!
I AM NOT A FINANCIAL ADVISOR.
THESE IDEAS ARE NOT ADVICE AND ARE FOR EDUCATION PURPOSES ONLY.
ALWAYS DO YOUR OWN RESEARCH!
JD.
You can contact me for info/access in PM or on Telegram: @jduyck
PLS, DON'T ASK FOR ACCESS IN THE COMMENT SECTION!
면책사항
해당 정보와 게시물은 금융, 투자, 트레이딩 또는 기타 유형의 조언이나 권장 사항으로 간주되지 않으며, 트레이딩뷰에서 제공하거나 보증하는 것이 아닙니다. 자세한 내용은 이용 약관을 참조하세요.
오픈 소스 스크립트
트레이딩뷰의 진정한 정신에 따라, 이 스크립트의 작성자는 이를 오픈소스로 공개하여 트레이더들이 기능을 검토하고 검증할 수 있도록 했습니다. 작성자에게 찬사를 보냅니다! 이 코드는 무료로 사용할 수 있지만, 코드를 재게시하는 경우 하우스 룰이 적용된다는 점을 기억하세요.
면책사항
해당 정보와 게시물은 금융, 투자, 트레이딩 또는 기타 유형의 조언이나 권장 사항으로 간주되지 않으며, 트레이딩뷰에서 제공하거나 보증하는 것이 아닙니다. 자세한 내용은 이용 약관을 참조하세요.