PROTECTED SOURCE SCRIPT
RSI Trendlines [RG]
Overview
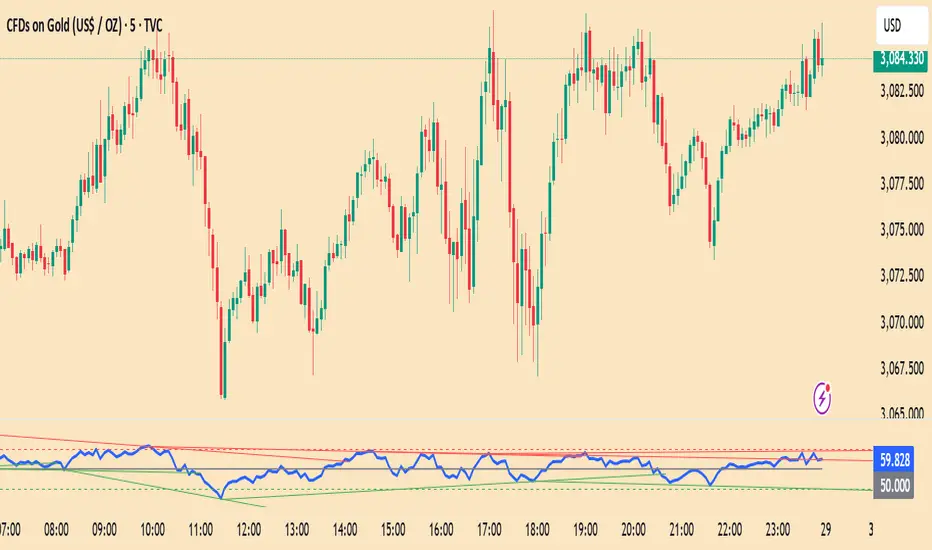
RSI Trendlines combines the power of automatic trendline detection with the popular Relative Strength Index (RSI) indicator. This tool identifies and plots dynamic support and resistance trendlines directly on the RSI chart, helping you spot potential trend changes and divergences in momentum before they appear in price.
Key Features
How It Works
Customization Options
Ideal For
This indicator aims to help traders move beyond static overbought/oversold levels by revealing the dynamic structure of momentum trends and highlighting potential reversals and continuations.
Please don't use this as a buy and sell indicator. Use it to get an idea on the market trend and as an extra confirmation for your trades. Happy Trading :)
RSI Trendlines combines the power of automatic trendline detection with the popular Relative Strength Index (RSI) indicator. This tool identifies and plots dynamic support and resistance trendlines directly on the RSI chart, helping you spot potential trend changes and divergences in momentum before they appear in price.
Key Features
- Automatically detects and draws trendlines on the RSI indicator
- Identifies significant pivot points in RSI momentum
- Customizable appearance with adjustable colors and line widths
- Built-in alerts for trendline breaks
How It Works
- The indicator calculates the standard RSI using your preferred settings
- It identifies pivot highs and lows in the RSI using the specified lookback period
- Valid trendlines are drawn connecting consecutive pivots
- Lines extend until they experience a confirmed break
Customization Options
- RSI Parameters: Adjust length and source to your preference
- Trendline Settings: Control pivot detection sensitivity and maximum lines
- Visual Options: Customize colors, line widths, and optional midline display
Ideal For
- Identifying established trends in momentum
- Spotting potential RSI divergences early
- Timing entries and exits based on momentum shifts
- Confirming trend changes with objective trendline breaks
This indicator aims to help traders move beyond static overbought/oversold levels by revealing the dynamic structure of momentum trends and highlighting potential reversals and continuations.
Please don't use this as a buy and sell indicator. Use it to get an idea on the market trend and as an extra confirmation for your trades. Happy Trading :)
보호된 스크립트입니다
이 스크립트는 비공개 소스로 게시됩니다. 하지만 이를 자유롭게 제한 없이 사용할 수 있습니다 – 자세한 내용은 여기에서 확인하세요.
면책사항
해당 정보와 게시물은 금융, 투자, 트레이딩 또는 기타 유형의 조언이나 권장 사항으로 간주되지 않으며, 트레이딩뷰에서 제공하거나 보증하는 것이 아닙니다. 자세한 내용은 이용 약관을 참조하세요.
보호된 스크립트입니다
이 스크립트는 비공개 소스로 게시됩니다. 하지만 이를 자유롭게 제한 없이 사용할 수 있습니다 – 자세한 내용은 여기에서 확인하세요.
면책사항
해당 정보와 게시물은 금융, 투자, 트레이딩 또는 기타 유형의 조언이나 권장 사항으로 간주되지 않으며, 트레이딩뷰에서 제공하거나 보증하는 것이 아닙니다. 자세한 내용은 이용 약관을 참조하세요.