OPEN-SOURCE SCRIPT
업데이트됨 OBV Breakout Screener (By Tarso)
1. Purpose of the Indicator
The "Advanced OBV Breakout Screener" is a specialized tool designed to find a powerful bullish signal. It scans for assets where buying pressure is increasing significantly, even though the price has not yet broken out.
The core strategy is to identify assets where:
Volume is leading Price: The On-Balance Volume (OBV) has already broken its recent high.
Price is still contained: The asset's price has not yet broken its recent high.
This setup helps you find potential trading opportunities right before a possible upward move.
2. How to Set Up the Indicator
First, you need to add the script to your TradingView account.
Open any chart on TradingView.
Click on the "Pine Editor" tab at the bottom of the screen.
Delete any existing code and paste the entire "Advanced OBV Breakout Screener" script into the editor.
Click "Add to chart". The indicator will now appear in a separate panel below your main price chart.
3. How to Use it with the Pine Screener (Step-by-Step)
This is the main purpose of the indicator. The script does all the complex analysis and provides a simple "1" (Signal is ON) or "0" (Signal is OFF). You only need to set up one filter.
Open the Stock Screener (or Crypto/Forex Screener).
Click the Filters button to open the settings panel.
Ensure you are on the Pine Screener tab (this allows you to filter using custom indicators).
In the indicator selection menu (it might say "Select Indicator..."), find and choose Advanced OBV Breakout Screener from your list.
Now, configure the single filter condition as follows:
In the first box, select Advanced Breakout Signal.
In the second box, select Equal to.
In the third box, select Number and type 1.
Your filter setup should look clean and simple, like this:
That's it! The screener will now display a list of all assets that currently meet the "Advanced Breakout" criteria for the timeframe you have selected (e.g., Daily, 4h, 1h).
4. Configuring the Lookback Period
By default, the indicator analyzes the last 20 periods. If you want to change this (for example, to scan for breakouts over 50 days), you must adjust it in the indicator's settings on your chart.
Go back to your chart view.
Find the "Advanced OBV Breakout Screener" panel.
Click the Settings icon (⚙️) next to the indicator's name.
In the "Inputs" tab, change the "Lookback Period (days)" to your desired value.
Click "OK".
The Pine Screener will automatically use this new setting for its market scan.
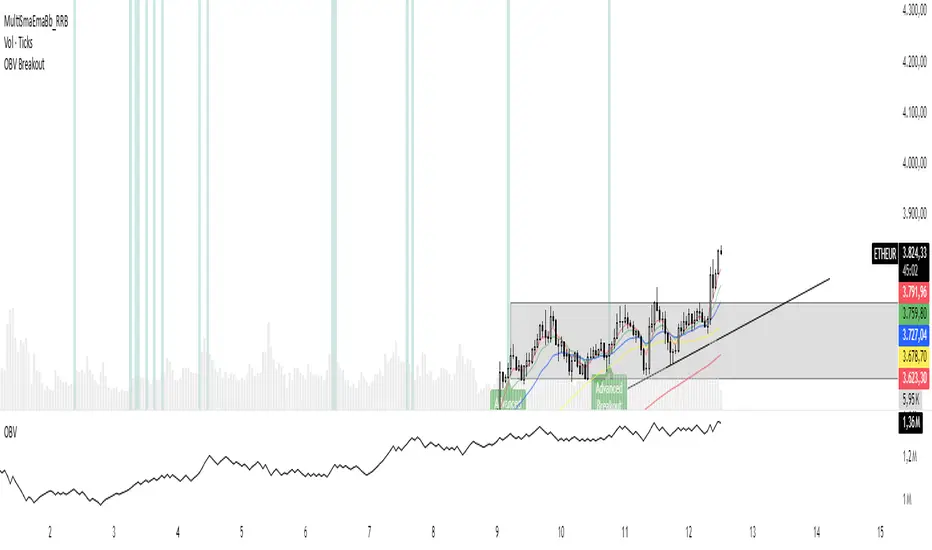
5. Understanding the On-Chart Visuals
When you add the indicator to your chart, you will see:
Blue Line: This is the On-Balance Volume (OBV).
Red Stepped Line: This represents the highest value the OBV has reached during the lookback period. A breakout happens when the blue line moves above this red line.
Green Triangle (▲): This symbol appears below a price candle whenever the full "Advanced Breakout" condition (OBV breakout + Price containment) is met, giving you a clear visual confirmation.
The "Advanced OBV Breakout Screener" is a specialized tool designed to find a powerful bullish signal. It scans for assets where buying pressure is increasing significantly, even though the price has not yet broken out.
The core strategy is to identify assets where:
Volume is leading Price: The On-Balance Volume (OBV) has already broken its recent high.
Price is still contained: The asset's price has not yet broken its recent high.
This setup helps you find potential trading opportunities right before a possible upward move.
2. How to Set Up the Indicator
First, you need to add the script to your TradingView account.
Open any chart on TradingView.
Click on the "Pine Editor" tab at the bottom of the screen.
Delete any existing code and paste the entire "Advanced OBV Breakout Screener" script into the editor.
Click "Add to chart". The indicator will now appear in a separate panel below your main price chart.
3. How to Use it with the Pine Screener (Step-by-Step)
This is the main purpose of the indicator. The script does all the complex analysis and provides a simple "1" (Signal is ON) or "0" (Signal is OFF). You only need to set up one filter.
Open the Stock Screener (or Crypto/Forex Screener).
Click the Filters button to open the settings panel.
Ensure you are on the Pine Screener tab (this allows you to filter using custom indicators).
In the indicator selection menu (it might say "Select Indicator..."), find and choose Advanced OBV Breakout Screener from your list.
Now, configure the single filter condition as follows:
In the first box, select Advanced Breakout Signal.
In the second box, select Equal to.
In the third box, select Number and type 1.
Your filter setup should look clean and simple, like this:
That's it! The screener will now display a list of all assets that currently meet the "Advanced Breakout" criteria for the timeframe you have selected (e.g., Daily, 4h, 1h).
4. Configuring the Lookback Period
By default, the indicator analyzes the last 20 periods. If you want to change this (for example, to scan for breakouts over 50 days), you must adjust it in the indicator's settings on your chart.
Go back to your chart view.
Find the "Advanced OBV Breakout Screener" panel.
Click the Settings icon (⚙️) next to the indicator's name.
In the "Inputs" tab, change the "Lookback Period (days)" to your desired value.
Click "OK".
The Pine Screener will automatically use this new setting for its market scan.
5. Understanding the On-Chart Visuals
When you add the indicator to your chart, you will see:
Blue Line: This is the On-Balance Volume (OBV).
Red Stepped Line: This represents the highest value the OBV has reached during the lookback period. A breakout happens when the blue line moves above this red line.
Green Triangle (▲): This symbol appears below a price candle whenever the full "Advanced Breakout" condition (OBV breakout + Price containment) is met, giving you a clear visual confirmation.
릴리즈 노트
Atualization릴리즈 노트
atualization릴리즈 노트
Atualization오픈 소스 스크립트
트레이딩뷰의 진정한 정신에 따라, 이 스크립트의 작성자는 이를 오픈소스로 공개하여 트레이더들이 기능을 검토하고 검증할 수 있도록 했습니다. 작성자에게 찬사를 보냅니다! 이 코드는 무료로 사용할 수 있지만, 코드를 재게시하는 경우 하우스 룰이 적용된다는 점을 기억하세요.
면책사항
해당 정보와 게시물은 금융, 투자, 트레이딩 또는 기타 유형의 조언이나 권장 사항으로 간주되지 않으며, 트레이딩뷰에서 제공하거나 보증하는 것이 아닙니다. 자세한 내용은 이용 약관을 참조하세요.
오픈 소스 스크립트
트레이딩뷰의 진정한 정신에 따라, 이 스크립트의 작성자는 이를 오픈소스로 공개하여 트레이더들이 기능을 검토하고 검증할 수 있도록 했습니다. 작성자에게 찬사를 보냅니다! 이 코드는 무료로 사용할 수 있지만, 코드를 재게시하는 경우 하우스 룰이 적용된다는 점을 기억하세요.
면책사항
해당 정보와 게시물은 금융, 투자, 트레이딩 또는 기타 유형의 조언이나 권장 사항으로 간주되지 않으며, 트레이딩뷰에서 제공하거나 보증하는 것이 아닙니다. 자세한 내용은 이용 약관을 참조하세요.