OPEN-SOURCE SCRIPT
Aroon Oscillator [BigBeluga]

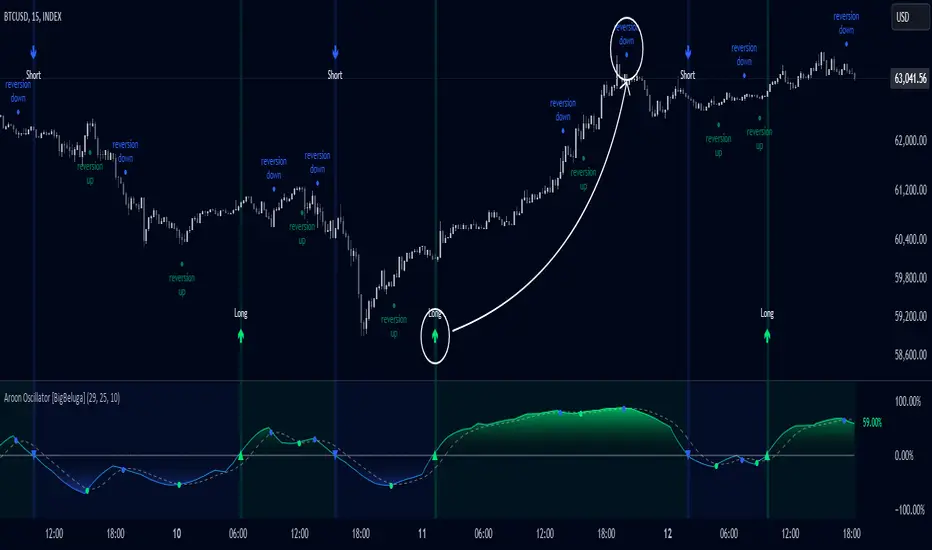
Aroon Oscillator with Mean Reversion & Trend Signals is a versatile tool that helps traders identify both trend direction and potential mean reversion points. The core Aroon Oscillator tracks the strength of a trend by measuring how long it has been since a high or low price occurred within a specified period. This oscillator provides trend-following signals (LONG/SHORT) along with mean reversion signals, giving traders both the ability to ride trends and anticipate reversals.
The unique feature of this indicator is the Mean Reversion Signals, marked with dots on the main chart, indicating potential points where the trend might reverse or retrace. In addition, trend-following signals (LONG and SHORT) are plotted directly on the chart, providing clear entry and exit points when a trend is beginning or ending.
🔵 IDEA
The Aroon Oscillator with Mean Reversion indicator provides a combined approach of trend analysis and mean reversion. The core idea is to track the health and momentum of trends, while also identifying when those trends might reverse or slow down. This dual approach allows traders to both follow the prevailing market direction and also capture mean reversion opportunities.
The oscillator is smoothed with John Ehlers' Zero Lag function, which helps reduce noise and improves signal clarity by removing lag without sacrificing the indicator's responsiveness.
The indicator uses color-coded signals and an easy-to-read oscillator to visually represent different types of signals on the chart. This makes it easy for traders to spot important changes in market trends and take action based on both the trend-following and mean reversion aspects of the indicator.
🔵 KEY FEATURES & USAGE
🔵 CUSTOMIZATION
The unique feature of this indicator is the Mean Reversion Signals, marked with dots on the main chart, indicating potential points where the trend might reverse or retrace. In addition, trend-following signals (LONG and SHORT) are plotted directly on the chart, providing clear entry and exit points when a trend is beginning or ending.
🔵 IDEA
The Aroon Oscillator with Mean Reversion indicator provides a combined approach of trend analysis and mean reversion. The core idea is to track the health and momentum of trends, while also identifying when those trends might reverse or slow down. This dual approach allows traders to both follow the prevailing market direction and also capture mean reversion opportunities.
The oscillator is smoothed with John Ehlers' Zero Lag function, which helps reduce noise and improves signal clarity by removing lag without sacrificing the indicator's responsiveness.
The indicator uses color-coded signals and an easy-to-read oscillator to visually represent different types of signals on the chart. This makes it easy for traders to spot important changes in market trends and take action based on both the trend-following and mean reversion aspects of the indicator.
🔵 KEY FEATURES & USAGE
- Trend Following Signals (LONG/SHORT):
In addition to mean reversion signals, the indicator also provides clear trend-following signals. LONG signals (green arrows) are plotted when the oscillator crosses above zero, indicating a potential uptrend. Conversely, SHORT signals (blue arrows) are plotted when the oscillator crosses below zero, signaling a potential downtrend. - Mean Reversion Signals:
This indicator features unique mean reversion signals, represented by dots on the main chart. These signals occur when the oscillator crosses over or under a smoother signal line, indicating that the current trend might be losing strength and a reversal or retracement is possible. Green dots represent a possible upward reversion, while blue dots signal a potential downward reversion. - Color-Coded Signals and Oscillator:
The Aroon Oscillator is color-coded to make it visually easier for traders to differentiate between trends and mean reversion signals. When the oscillator is above zero, the area is filled with green, and when it is below zero, the area is filled with blue. This visual representation helps traders quickly identify the current market condition at a glance.
🔵 CUSTOMIZATION
- Aroon Length & Smoothing: Control the sensitivity of the Aroon Oscillator by adjusting the lookback period and smoothing settings, allowing traders to fine-tune the indicator to match different market conditions.
- Mean Reversion Signals: Enable or disable mean reversion signals based on your trading preferences. Adjust the signal line length to control when these reversal signals are triggered.
- Color Customization: Customize the colors for the oscillator and signals to match your chart’s color scheme for better visual clarity.
오픈 소스 스크립트
트레이딩뷰의 진정한 정신에 따라, 이 스크립트의 작성자는 이를 오픈소스로 공개하여 트레이더들이 기능을 검토하고 검증할 수 있도록 했습니다. 작성자에게 찬사를 보냅니다! 이 코드는 무료로 사용할 수 있지만, 코드를 재게시하는 경우 하우스 룰이 적용된다는 점을 기억하세요.
🔵Gain access to our powerful tools : bigbeluga.com/tv
🔵Join our free discord for updates : bigbeluga.com/discord
All scripts & content provided by BigBeluga are for informational & educational purposes only.
🔵Join our free discord for updates : bigbeluga.com/discord
All scripts & content provided by BigBeluga are for informational & educational purposes only.
면책사항
해당 정보와 게시물은 금융, 투자, 트레이딩 또는 기타 유형의 조언이나 권장 사항으로 간주되지 않으며, 트레이딩뷰에서 제공하거나 보증하는 것이 아닙니다. 자세한 내용은 이용 약관을 참조하세요.