INVITE-ONLY SCRIPT
Top Catcher | QR
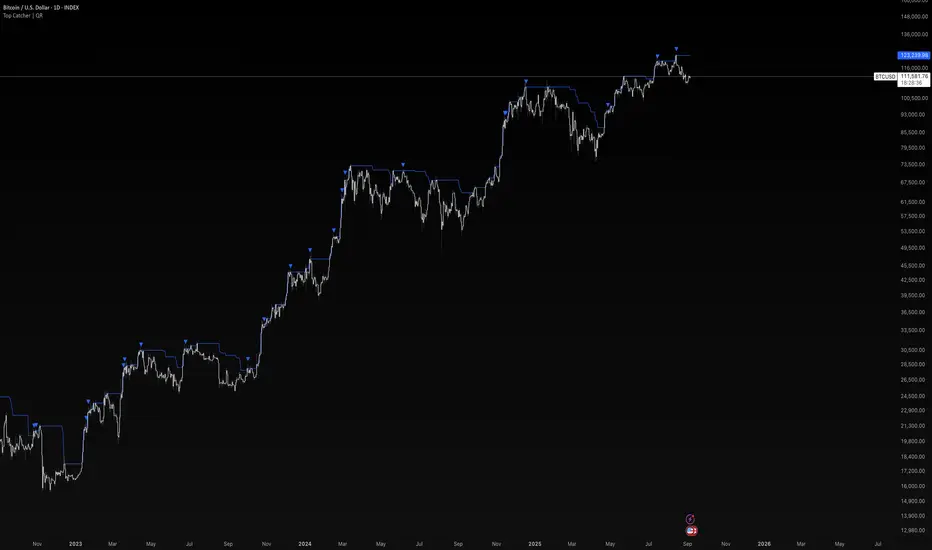
Top Catcher | QuantumResearch
The Top Catcher indicator is designed to help traders spot areas where markets may be forming local tops. Instead of relying on simple overbought measures like RSI or Bollinger Bands, it combines percentile-based price extremes with a volatility-adjusted filter. This approach helps highlight situations where price has stretched unusually far and then shows signs of weakness.
🔍 How It Works (Principle)
Percentile Analysis: The script measures whether price has reached an extreme compared to its recent distribution (very high percentile).
Volatility Confirmation: It checks if price fails to sustain above a volatility-adjusted upper boundary.
Signal Generation: Only when both conditions align does the script mark a potential Top with a visual triangle above the bar.
This dual-layer approach aims to reduce false signals often triggered in strong trends by single-metric tools.
🎯 Key Features
Top Signals: Plots a clear triangle above candles when potential exhaustion is detected.
Dynamic Adaptation: Works across different assets and timeframes by adjusting to each market’s own volatility.
Visual Overlay: Signals are plotted directly on the chart for intuitive reading.
Alert Ready: Built-in alerts let traders get notified as soon as a new Top signal is generated.
📈 How To Use
Trend Traders: Use signals to tighten stops or take partial profits in extended runs.
Swing Traders: Watch for reversal setups at local highs.
Multi-Timeframe Approach: Combine higher timeframe signals with intraday charts for confirmation.
The script is not meant to predict exact tops, but rather to provide an early warning of distribution zones where risk increases.
⚠️ Disclaimer
This tool is provided for educational and research purposes only. It is not financial advice. Past performance does not predict or guarantee future results. Always combine this tool with your own analysis and risk management.
초대 전용 스크립트
이 스크립트는 작성자가 승인한 사용자만 접근할 수 있습니다. 사용하려면 요청을 보내고 승인을 받아야 합니다. 일반적으로 결제 후에 승인이 이루어집니다. 자세한 내용은 아래 작성자의 지침을 따르거나 QuantumResearch에게 직접 문의하세요.
트레이딩뷰는 스크립트 작성자를 완전히 신뢰하고 스크립트 작동 방식을 이해하지 않는 한 스크립트 비용을 지불하거나 사용하지 않는 것을 권장하지 않습니다. 무료 오픈소스 대체 스크립트는 커뮤니티 스크립트에서 찾을 수 있습니다.
작성자 지시 사항
Access this script here: https://whop.com/quantum-whop/
🌐 Gain access to our cutting-edge tools:
whop.com/quantum-whop/
⚒️ Get access to our toolbox here for free:
quantumresearchportfolio.carrd.co
All tools and content provided are for informational and educational purposes only.
whop.com/quantum-whop/
⚒️ Get access to our toolbox here for free:
quantumresearchportfolio.carrd.co
All tools and content provided are for informational and educational purposes only.
면책사항
이 정보와 게시물은 TradingView에서 제공하거나 보증하는 금융, 투자, 거래 또는 기타 유형의 조언이나 권고 사항을 의미하거나 구성하지 않습니다. 자세한 내용은 이용 약관을 참고하세요.