PROTECTED SOURCE SCRIPT
업데이트됨 Daily Fractals
Custom Timeframe Candles - Fractal Analysis Tool
📊 Overview
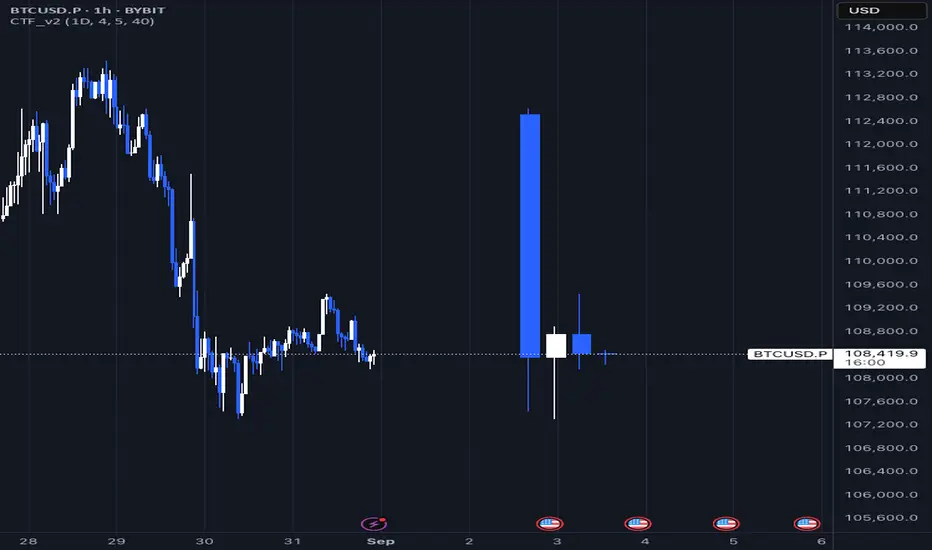
Custom Timeframe Candles is a powerful Pine Script indicator that displays higher timeframe (HTF) candles directly on your current chart, enabling seamless fractal analysis without switching between timeframes.
Perfect for traders who want to analyze daily candles while trading on hourly charts, or any other timeframe combination.
✨ Key Features
🎯 Multi-Timeframe Analysis
- Display any higher timeframe candles on your current chart
- Real-time updates of the current HTF candle as price moves
- Configurable number of candles (1-10) to display
🎮 How to Use
1. Add to Chart: Apply the indicator to any timeframe chart
2. Select HTF: Choose your desired higher timeframe (e.g., "1D" for daily)
3. Configure Display: Set number of candles, colors, and position
4. Analyze: View HTF context while trading on lower timeframes
📈 Perfect For Backtest
Unlike basic HTF displays, this indicator provides:
- Live Updates: Current candle updates in real-time
- Complete OHLC: Full candle structure with wicks
- Flexible Count: Display exactly what you need
- Stable Performance: No crashes during replay/backtesting
- Professional Design: Clean, customizable appearance
📝 Notes
- Works on all timeframes and instruments
- Requires higher timeframe data availability
- Compatible with replay mode and backtesting
---
by Rock9808
📊 Overview
Custom Timeframe Candles is a powerful Pine Script indicator that displays higher timeframe (HTF) candles directly on your current chart, enabling seamless fractal analysis without switching between timeframes.
Perfect for traders who want to analyze daily candles while trading on hourly charts, or any other timeframe combination.
✨ Key Features
🎯 Multi-Timeframe Analysis
- Display any higher timeframe candles on your current chart
- Real-time updates of the current HTF candle as price moves
- Configurable number of candles (1-10) to display
🎮 How to Use
1. Add to Chart: Apply the indicator to any timeframe chart
2. Select HTF: Choose your desired higher timeframe (e.g., "1D" for daily)
3. Configure Display: Set number of candles, colors, and position
4. Analyze: View HTF context while trading on lower timeframes
📈 Perfect For Backtest
Unlike basic HTF displays, this indicator provides:
- Live Updates: Current candle updates in real-time
- Complete OHLC: Full candle structure with wicks
- Flexible Count: Display exactly what you need
- Stable Performance: No crashes during replay/backtesting
- Professional Design: Clean, customizable appearance
📝 Notes
- Works on all timeframes and instruments
- Requires higher timeframe data availability
- Compatible with replay mode and backtesting
---
by Rock9808
릴리즈 노트
remove debug릴리즈 노트
Remove debugging option릴리즈 노트
Published something보호된 스크립트입니다
이 스크립트는 비공개 소스로 게시됩니다. 하지만 이를 자유롭게 제한 없이 사용할 수 있습니다 – 자세한 내용은 여기에서 확인하세요.
면책사항
해당 정보와 게시물은 금융, 투자, 트레이딩 또는 기타 유형의 조언이나 권장 사항으로 간주되지 않으며, 트레이딩뷰에서 제공하거나 보증하는 것이 아닙니다. 자세한 내용은 이용 약관을 참조하세요.
면책사항
해당 정보와 게시물은 금융, 투자, 트레이딩 또는 기타 유형의 조언이나 권장 사항으로 간주되지 않으며, 트레이딩뷰에서 제공하거나 보증하는 것이 아닙니다. 자세한 내용은 이용 약관을 참조하세요.