OPEN-SOURCE SCRIPT
Comparaison DXY, VIX, SPX, DJI, GVZ
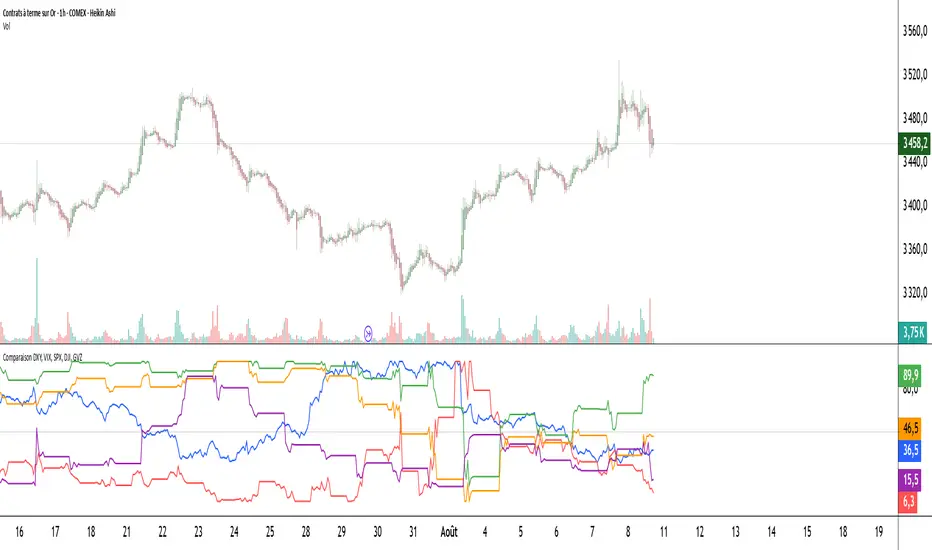
Pine Script indicator compares the normalized values of DXY, VIX, SPX, DJI, and GVZ indices on a single scale from 0 to 100. Here's a breakdown of what it does:
Data Requests: Gets closing prices for:
US Dollar Index (DXY)
VIX Volatility Index
S&P 500 (SPX)
Dow Jones Industrial Average (DJI)
Gold Volatility Index (GVZ)
Normalization: Each index is normalized using a 500-period lookback to scale values between 0-100, making them comparable despite different price scales.
Visualization:
Plots each normalized index with distinct colors
Adds a dotted midline at 50 for reference
Uses thicker linewidth (2) for better visibility
Timeframe Flexibility: Works on any chart timeframe since it uses timeframe.period
This is useful for:
Comparing relative strength/weakness between these key market indicators
Identifying divergences or convergences in their movements
Seeing how different asset classes (currencies, equities, volatility) relate
You could enhance this by:
Adding correlation calculations between pairs
Including options to adjust the normalization period
Adding alerts when instruments diverge beyond certain thresholds
Including volume or other metrics alongside price
오픈 소스 스크립트
트레이딩뷰의 진정한 정신에 따라, 이 스크립트의 작성자는 이를 오픈소스로 공개하여 트레이더들이 기능을 검토하고 검증할 수 있도록 했습니다. 작성자에게 찬사를 보냅니다! 이 코드는 무료로 사용할 수 있지만, 코드를 재게시하는 경우 하우스 룰이 적용된다는 점을 기억하세요.
면책사항
해당 정보와 게시물은 금융, 투자, 트레이딩 또는 기타 유형의 조언이나 권장 사항으로 간주되지 않으며, 트레이딩뷰에서 제공하거나 보증하는 것이 아닙니다. 자세한 내용은 이용 약관을 참조하세요.
오픈 소스 스크립트
트레이딩뷰의 진정한 정신에 따라, 이 스크립트의 작성자는 이를 오픈소스로 공개하여 트레이더들이 기능을 검토하고 검증할 수 있도록 했습니다. 작성자에게 찬사를 보냅니다! 이 코드는 무료로 사용할 수 있지만, 코드를 재게시하는 경우 하우스 룰이 적용된다는 점을 기억하세요.
면책사항
해당 정보와 게시물은 금융, 투자, 트레이딩 또는 기타 유형의 조언이나 권장 사항으로 간주되지 않으며, 트레이딩뷰에서 제공하거나 보증하는 것이 아닙니다. 자세한 내용은 이용 약관을 참조하세요.