PROTECTED SOURCE SCRIPT
Traders Dynamic Index
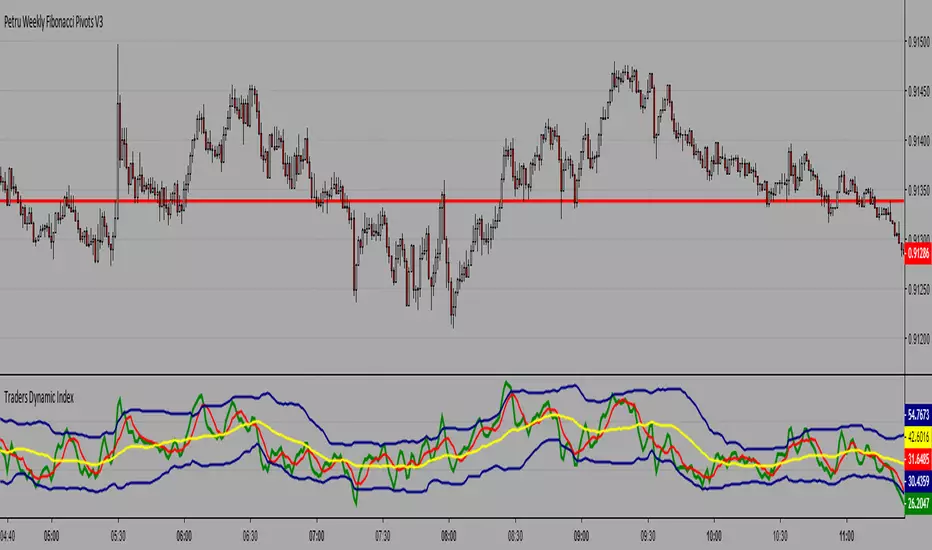
At a first glance, Traders Dynamic Index is not too easy to use, but you will get accustomed to it:
For scalping, enter long when the green line is above the red line and enter short when the red line is the above green line.
For short-term trading, enter long when the green is above both the red and the yellow lines; enter short when the red one is above both the green and the yellow ones.
For medium-term trading, go long under the same conditions as for the short-term trading but only when all lines are below 50; to go short — the same but above 50.
8
Mind the blue volatility band as it points to the long-term trend strength and volatility when wide. Steep green line changes also signal short-term market volatility.
보호된 스크립트입니다
이 스크립트는 비공개 소스로 게시됩니다. 하지만 이를 자유롭게 제한 없이 사용할 수 있습니다 – 자세한 내용은 여기에서 확인하세요.
면책사항
해당 정보와 게시물은 금융, 투자, 트레이딩 또는 기타 유형의 조언이나 권장 사항으로 간주되지 않으며, 트레이딩뷰에서 제공하거나 보증하는 것이 아닙니다. 자세한 내용은 이용 약관을 참조하세요.
보호된 스크립트입니다
이 스크립트는 비공개 소스로 게시됩니다. 하지만 이를 자유롭게 제한 없이 사용할 수 있습니다 – 자세한 내용은 여기에서 확인하세요.
면책사항
해당 정보와 게시물은 금융, 투자, 트레이딩 또는 기타 유형의 조언이나 권장 사항으로 간주되지 않으며, 트레이딩뷰에서 제공하거나 보증하는 것이 아닙니다. 자세한 내용은 이용 약관을 참조하세요.