PROTECTED SOURCE SCRIPT
Pascal's Market Compression Oscillator
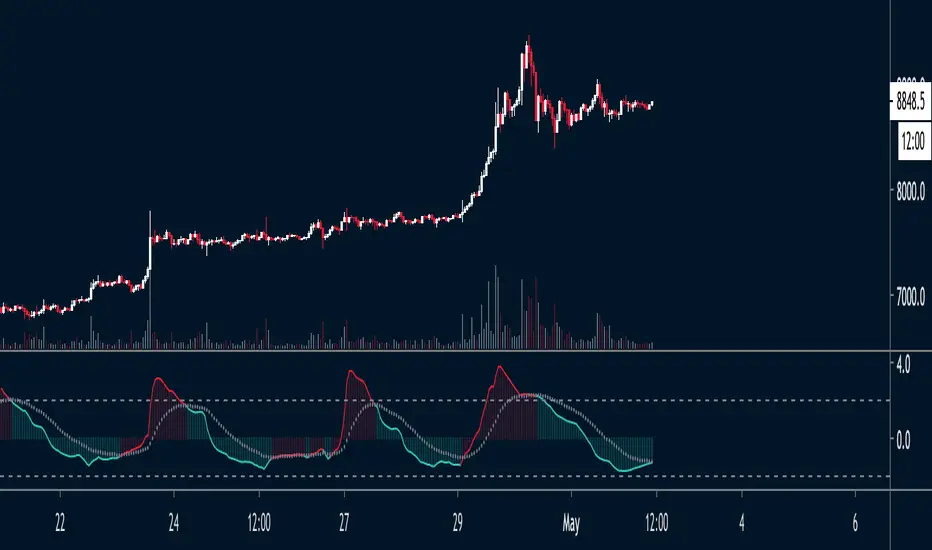
The indicator uses a standardized measure of volume and volatility to visualize the compression state of the market.
- Green: Market is currently compressing
- Red: Market is currently expanding
When the oscillator flips from Green to Red, the market is likely to enter a phase of expansion. This opens a window of opportunity for momentum strategies.
When the oscillator flips from Red to Green, the market is likely to enter a phase of compression. This makes it a favorable regime for mean reversion strategies.
Finally, please note that the indicator is NOT meant for directional analysis. e.g. when the oscillator signals "expansion", that can be up OR down.
보호된 스크립트입니다
이 스크립트는 비공개 소스로 게시됩니다. 하지만 이를 자유롭게 제한 없이 사용할 수 있습니다 – 자세한 내용은 여기에서 확인하세요.
면책사항
해당 정보와 게시물은 금융, 투자, 트레이딩 또는 기타 유형의 조언이나 권장 사항으로 간주되지 않으며, 트레이딩뷰에서 제공하거나 보증하는 것이 아닙니다. 자세한 내용은 이용 약관을 참조하세요.
보호된 스크립트입니다
이 스크립트는 비공개 소스로 게시됩니다. 하지만 이를 자유롭게 제한 없이 사용할 수 있습니다 – 자세한 내용은 여기에서 확인하세요.
면책사항
해당 정보와 게시물은 금융, 투자, 트레이딩 또는 기타 유형의 조언이나 권장 사항으로 간주되지 않으며, 트레이딩뷰에서 제공하거나 보증하는 것이 아닙니다. 자세한 내용은 이용 약관을 참조하세요.