OPEN-SOURCE SCRIPT
Intraday Trend Candles
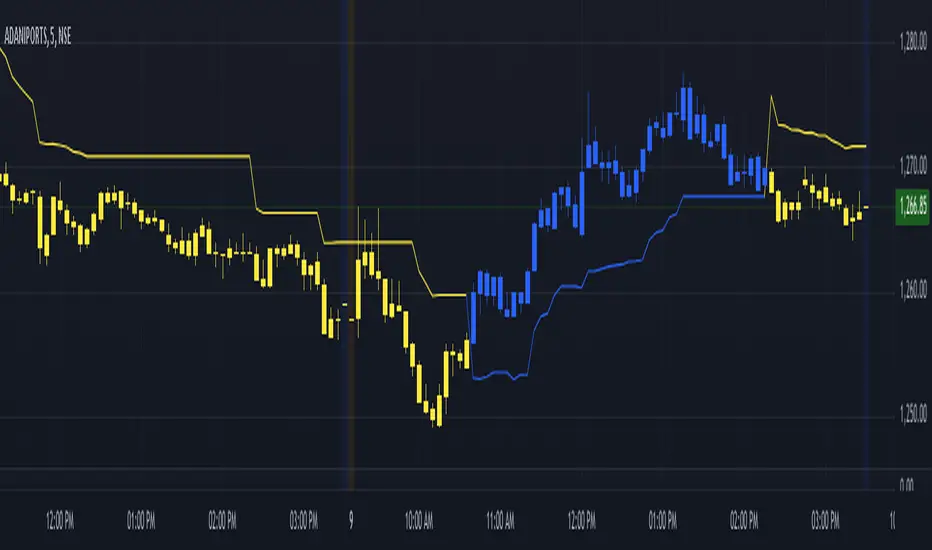
The Intraday Trend Candles (ITC) indicator is a Pine Script-based tool designed for traders seeking to visualize market trends effectively. Using a combination of the Look Back Period, a multiplier for true range, and linearly weighted moving averages (LWMA), this indicator calculates dynamic trend limits that adapt to price movements. It identifies key trend shifts by comparing the current price to these dynamic thresholds, resulting in a visually intuitive display of market bias directly on the chart. The indicator is particularly well-suited for intraday trading, as it provides responsive insights tailored to short-term price action.
The ITC plots color-coded candles, highlighting bullish trends in blue and bearish trends in yellow, with gray indicating indecision or trend continuation. This color-coded approach makes it easy to identify reversals and trend dynamics at a glance. Additionally, a trend line is plotted to enhance clarity, signaling whether the price is favoring the upper or lower threshold of the calculated range. With built-in alerts for trend reversals, traders can stay informed about critical market shifts without constantly monitoring the chart. This combination of visual cues and alerts makes the ITC a versatile and powerful tool for traders focusing on momentum and trend-following strategies.
The ITC plots color-coded candles, highlighting bullish trends in blue and bearish trends in yellow, with gray indicating indecision or trend continuation. This color-coded approach makes it easy to identify reversals and trend dynamics at a glance. Additionally, a trend line is plotted to enhance clarity, signaling whether the price is favoring the upper or lower threshold of the calculated range. With built-in alerts for trend reversals, traders can stay informed about critical market shifts without constantly monitoring the chart. This combination of visual cues and alerts makes the ITC a versatile and powerful tool for traders focusing on momentum and trend-following strategies.
오픈 소스 스크립트
트레이딩뷰의 진정한 정신에 따라, 이 스크립트의 작성자는 이를 오픈소스로 공개하여 트레이더들이 기능을 검토하고 검증할 수 있도록 했습니다. 작성자에게 찬사를 보냅니다! 이 코드는 무료로 사용할 수 있지만, 코드를 재게시하는 경우 하우스 룰이 적용된다는 점을 기억하세요.
면책사항
해당 정보와 게시물은 금융, 투자, 트레이딩 또는 기타 유형의 조언이나 권장 사항으로 간주되지 않으며, 트레이딩뷰에서 제공하거나 보증하는 것이 아닙니다. 자세한 내용은 이용 약관을 참조하세요.
오픈 소스 스크립트
트레이딩뷰의 진정한 정신에 따라, 이 스크립트의 작성자는 이를 오픈소스로 공개하여 트레이더들이 기능을 검토하고 검증할 수 있도록 했습니다. 작성자에게 찬사를 보냅니다! 이 코드는 무료로 사용할 수 있지만, 코드를 재게시하는 경우 하우스 룰이 적용된다는 점을 기억하세요.
면책사항
해당 정보와 게시물은 금융, 투자, 트레이딩 또는 기타 유형의 조언이나 권장 사항으로 간주되지 않으며, 트레이딩뷰에서 제공하거나 보증하는 것이 아닙니다. 자세한 내용은 이용 약관을 참조하세요.