PROTECTED SOURCE SCRIPT
QFI Pro - Adaptive Flow with SCT & Divergence Scanner
█ OVERVIEW
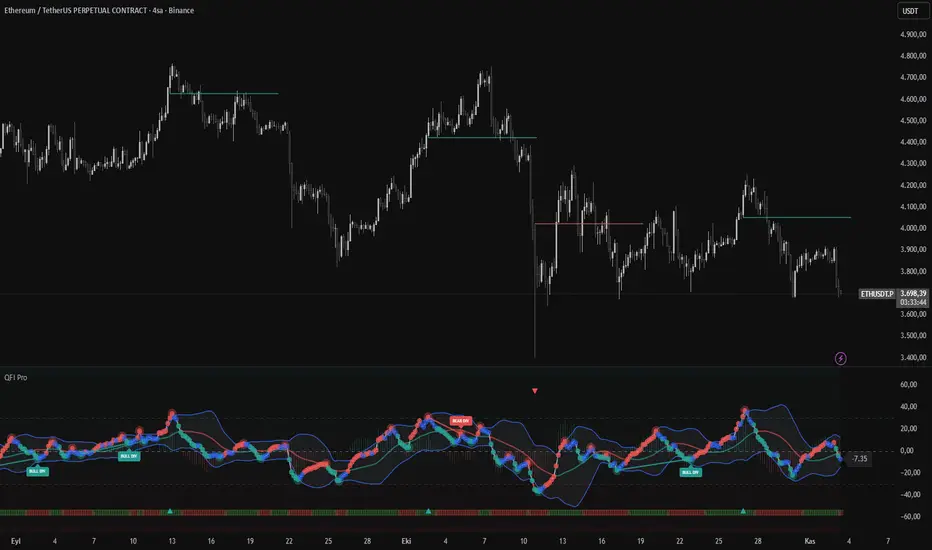
QFI Pro is an advanced momentum oscillator combining adaptive volume flow analysis, pattern recognition, and multi-timeframe divergence detection. Features proprietary Support/Challenge/Test (SCT) line system with infinite extension capability for dynamic price level identification.
█ COMPLETE FEATURE SET
Core Oscillator:
- Quantum Flow Index: -100 to +100 normalized scale
- Adaptive kernel smoothing with volatility-based bandwidth
- Volume-weighted momentum with optional RSI fusion
- Real-time and historical pivot detection
- QFI Candle visualization mode
Pattern Recognition:
- Automatic divergence detection (regular & hidden)
- Multi-divergence scanner with threshold filtering
- Higher High/Higher Low/Lower Low/Lower High labeling
- Head and shoulders pattern identification
- Trend breakout detection
SCT System:
- Dynamic support/resistance from momentum shifts
- Infinite or fixed-length line extensions
- Multi-divergence SCT with enhanced confirmation
- Chart overlay or oscillator panel display modes
- Customizable line styles (solid/dotted/dashed)
Technical Overlays:
- Multiple MA types: SMA/EMA/WMA/HMA/ALMA/VWMA
- Bollinger Bands with adjustable deviation
- Stochastic QFI (K/D with smoothing)
- QFI-MA histogram for momentum visualization
- MACD histogram overlay on QFI values
- Normal bar marking for non-pivot candles
Visual Components:
- Overbought/Oversold dot markers
- Real-time QFI value label
- Optional information table with component breakdown
- Customizable color schemes
- Background highlighting for extreme zones
█ SIGNAL INTERPRETATION
Primary Signals:
- QFI crosses above 30 → Bullish signal + Green SCT line
- QFI crosses below -30 → Bearish signal + Red SCT line
- QFI > 70 → Strong bullish/overbought zone
- QFI < -70 → Strong bearish/oversold zone
Divergence Signals:
- BULL DIV: Price makes lower low, QFI makes higher low
- BEAR DIV: Price makes higher high, QFI makes lower high
- Multi-Divergence: Divergence + extreme QFI levels (blue/orange SCT)
Pattern Labels:
- HH = Higher High (bearish continuation)
- LH = Lower High (bearish reversal)
- HL = Higher Low (bullish reversal)
- LL = Lower Low (bearish continuation)
█ ALERT CONDITIONS
The indicator includes 6 customizable alerts:
1. QFI Buy Signal (crosses above threshold)
2. QFI Sell Signal (crosses below threshold)
3. Strong Buy Condition (QFI > 70)
4. Strong Sell Condition (QFI < -70)
5. Stochastic Oversold (K crosses above 20)
6. Stochastic Overbought (K crosses below 80)
█ INPUT PARAMETERS
Core Configuration:
- Lookback Period [20-100]: Sensitivity control
- Buy Threshold [20-50]: Bullish signal trigger
- Sell Threshold [-50 to -20]: Bearish signal trigger
Component Weights (must sum to 100%):
- Volume Weight [0-1]: Volume flow influence
- Pattern Weight [0-1]: Pattern detection influence
- Momentum Weight [0-1]: Momentum calculation influence
- Volatility Weight [0-1]: Volatility factor influence
- RSI Weight [0-1]: RSI fusion influence (when enabled)
SCT System:
- Max SCT Lines [1-10]: Concurrent lines displayed
- SCT Bars [1-500]: Line extension length
- Infinite Lines: Toggle infinite extension
- Display Mode: Chart overlay vs oscillator panel
Divergence Settings:
- Divergence Lookback [1-20]: Pivot detection period
- High Threshold [50-90]: Multi-divergence overbought level
- Low Threshold [10-50]: Multi-divergence oversold level
- Show HH/HL/LL/LH: Toggle pattern labels
Display Options:
- Moving Average Type & Length
- Bollinger Band StdDev multiplier
- Stochastic K/D/Smooth periods
- QFI Candles toggle
- Info Table toggle
- Various visual elements toggles
█ TECHNICAL METHODOLOGY
Mathematical Foundation:
- Hyperbolic tangent (tanh) normalization for bounded outputs
- Gaussian kernel regression with adaptive bandwidth
- Volume-price divergence via OBV trend analysis
- Multi-period momentum aggregation (5/10/20 bars)
- ATR-based volatility scoring with historical comparison
Calculation Pipeline:
1. Adaptive bandwidth determination from market volatility
2. Component calculation (volume/pattern/momentum/volatility)
3. Weighted aggregation with normalized coefficients
4. EMA smoothing for final QFI output
5. Secondary calculations (MA, Stochastic, Divergence)
█ RECOMMENDED SETTINGS
Scalping (1-15min):
- Lookback: 20-30, SCT Bars: 20-30, Max Lines: 2-3
Day Trading (15min-1H):
- Lookback: 35-50, SCT Bars: 50, Max Lines: 3-5
Swing Trading (1H-4H):
- Lookback: 50-75, SCT Bars: 100, Max Lines: 3-5, Infinite: ON
Position Trading (Daily+):
- Lookback: 75-100, SCT Bars: 200+, Max Lines: 5-10, Infinite: ON
█ BEST PRACTICES
- Use on liquid instruments with reliable volume
- Combine with price action for confirmation
- SCT lines are dynamic - adjust stops accordingly
- Divergences work best in ranging markets
- Monitor multiple timeframes for confluence
- Reduce position size in low volatility periods
█ LIMITATIONS
- Requires volume data (not suitable for some instruments)
- May lag during rapid price movements
- SCT lines are projections, not guarantees
- False signals possible during news events
- Divergences need additional confirmation
- Not optimized for markets with frequent gaps
█ DISCLAIMER
This indicator is for educational and informational purposes only. It should not be considered as financial advice or a recommendation to buy or sell any financial instrument. Past performance does not guarantee future results. Trading involves substantial risk of loss. Always conduct your own analysis and consider your financial situation before making trading decisions.
█ VERSION
Version 1.0 | Pine Script™ v5
Tested on: Forex, Indices, Cryptocurrencies, Stocks
Minimum timeframe: 15 minutes recommended
© 2025 Professional Trading Tools
────────────────────
For support and updates, check the comment section below.
보호된 스크립트입니다
이 스크립트는 비공개 소스로 게시됩니다. 하지만 제한 없이 자유롭게 사용할 수 있습니다 — 여기에서 자세히 알아보기.
Developer & Trader
면책사항
이 정보와 게시물은 TradingView에서 제공하거나 보증하는 금융, 투자, 거래 또는 기타 유형의 조언이나 권고 사항을 의미하거나 구성하지 않습니다. 자세한 내용은 이용 약관을 참고하세요.
보호된 스크립트입니다
이 스크립트는 비공개 소스로 게시됩니다. 하지만 제한 없이 자유롭게 사용할 수 있습니다 — 여기에서 자세히 알아보기.
Developer & Trader
면책사항
이 정보와 게시물은 TradingView에서 제공하거나 보증하는 금융, 투자, 거래 또는 기타 유형의 조언이나 권고 사항을 의미하거나 구성하지 않습니다. 자세한 내용은 이용 약관을 참고하세요.