OPEN-SOURCE SCRIPT
Sine Wave
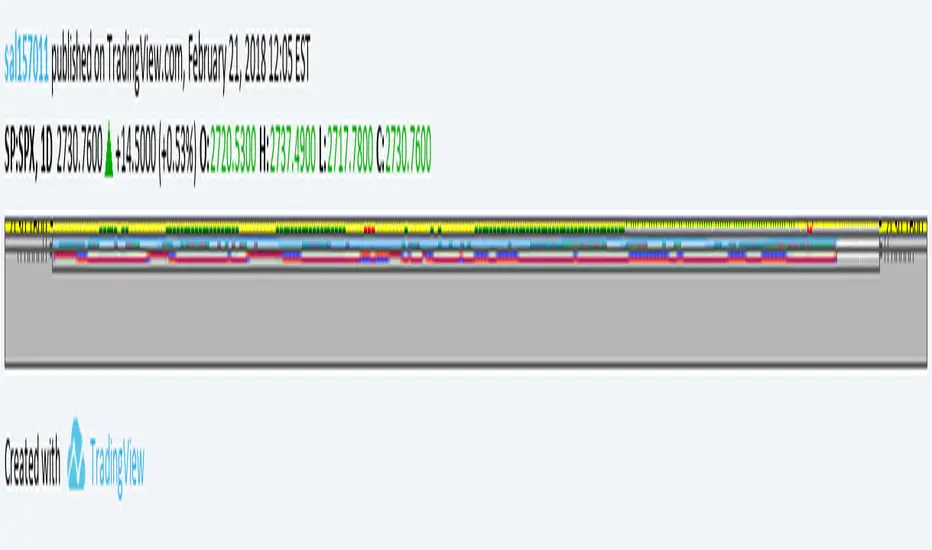
This is John F. Ehlers, Hilbert Sine Wave with barcolor and bgcolor.
When fast line red crosses down slow line blue that is a zone of resistance in the price chart, and when fast line crosses up slow line blue that is a zone of support.
When close of the bar is equal or greater than the zone of resistance there is a trend up mode in place and trending instruments like Hull moving average should be used, and when the close of the bar is equal or greater than the zone of resistance there is a trend down in place and trending instruments should be used too.
When none of the preceeding conditions are valid there is a cycle mode, and cycle instruments like oscillators, stochastics and the Sine Wave itself should be used. Note that the Sine Wave is almost always a leading indicator when in a cycle mode.
Barcolor and bgcolor mean: Green = Trend Up , Red = Trend Down, Yellow= Cycle mode
오픈 소스 스크립트
트레이딩뷰의 진정한 정신에 따라, 이 스크립트의 작성자는 이를 오픈소스로 공개하여 트레이더들이 기능을 검토하고 검증할 수 있도록 했습니다. 작성자에게 찬사를 보냅니다! 이 코드는 무료로 사용할 수 있지만, 코드를 재게시하는 경우 하우스 룰이 적용된다는 점을 기억하세요.
면책사항
해당 정보와 게시물은 금융, 투자, 트레이딩 또는 기타 유형의 조언이나 권장 사항으로 간주되지 않으며, 트레이딩뷰에서 제공하거나 보증하는 것이 아닙니다. 자세한 내용은 이용 약관을 참조하세요.
오픈 소스 스크립트
트레이딩뷰의 진정한 정신에 따라, 이 스크립트의 작성자는 이를 오픈소스로 공개하여 트레이더들이 기능을 검토하고 검증할 수 있도록 했습니다. 작성자에게 찬사를 보냅니다! 이 코드는 무료로 사용할 수 있지만, 코드를 재게시하는 경우 하우스 룰이 적용된다는 점을 기억하세요.
면책사항
해당 정보와 게시물은 금융, 투자, 트레이딩 또는 기타 유형의 조언이나 권장 사항으로 간주되지 않으며, 트레이딩뷰에서 제공하거나 보증하는 것이 아닙니다. 자세한 내용은 이용 약관을 참조하세요.