OPEN-SOURCE SCRIPT
업데이트됨 High-Low of X Bar
Overview
Key Features
Inputs
Color Settings
Usage Instructions
Notes
- The High-Low of X Bar indicator allows traders to visualize historical high and low values from a specific number of bars ago directly on the chart.
- Provides insight into past price action by displaying high, low, and their difference at the most recent bar.
- Customizable inputs and color settings for labels enhance usability and visual integration with your chart.
Key Features
- Historical Data Analysis: Displays the high, low, and the difference between these values from a specified number of bars ago.
- Customizable Inputs: Set the number of bars ago to review historical price points, with a range from 1 to 2000 bars. Premium users can exceed this range.
- Dynamic Labeling: Option to show high, low, and difference values as labels on the chart, with customizable text and background colors.
- Color Customization: Customize label colors for high, low, and difference values, as well as for cases with insufficient bars.
Inputs
- Number of Bars Ago: Enter the number of bars back from the current bar to analyze historical high and low values.
- Show High Value: Toggle to display the historical high value.
- Show Low Value: Toggle to display the historical low value.
- Show Difference Value: Toggle to display the difference between high and low values.
Color Settings
- High Label Background Color: Set the background color of the high value label.
- High Label Text Color: Choose the text color for the high value label.
- Low Label Background Color: Set the background color of the low value label.
- Low Label Text Color: Choose the text color for the low value label.
- Difference Label Background Color: Set the background color of the difference label.
- Difference Label Text Color: Choose the text color for the difference label.
- Not Enough Bars Label Background Color: Set the background color for the label shown when there are insufficient bars.
- Not Enough Bars Label Text Color: Choose the text color for the insufficient bars label.
Usage Instructions
- Add to Chart: Apply the High-Low of X Bar indicator to your TradingView chart.
- Configure Settings: Adjust the number of bars ago and display options according to your analysis needs.
- Customize Appearance: Set the colors for the labels to match your chart's style.
- Analyze: Review the high, low, and their difference directly on your chart for immediate insights into past price movements.
Notes
- Ensure your chart has sufficient historical data for the indicator to function properly.
- Customize label visibility and colors based on your preference and trading strategy.
릴리즈 노트
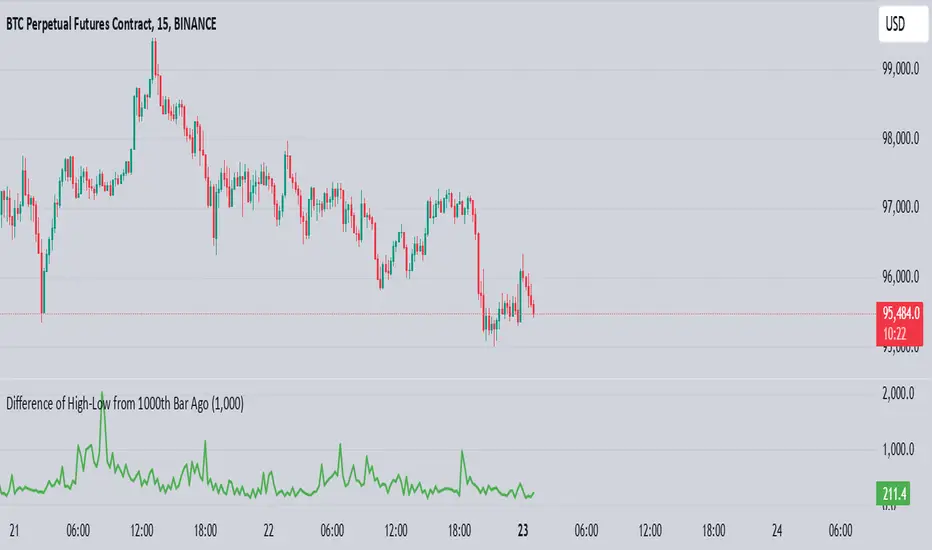
Added a line chart to visualize the difference of high and low if X (e.g., 1000th) bar from the current one. X can be adjusted as needed. 오픈 소스 스크립트
트레이딩뷰의 진정한 정신에 따라, 이 스크립트의 작성자는 이를 오픈소스로 공개하여 트레이더들이 기능을 검토하고 검증할 수 있도록 했습니다. 작성자에게 찬사를 보냅니다! 이 코드는 무료로 사용할 수 있지만, 코드를 재게시하는 경우 하우스 룰이 적용된다는 점을 기억하세요.
면책사항
해당 정보와 게시물은 금융, 투자, 트레이딩 또는 기타 유형의 조언이나 권장 사항으로 간주되지 않으며, 트레이딩뷰에서 제공하거나 보증하는 것이 아닙니다. 자세한 내용은 이용 약관을 참조하세요.
오픈 소스 스크립트
트레이딩뷰의 진정한 정신에 따라, 이 스크립트의 작성자는 이를 오픈소스로 공개하여 트레이더들이 기능을 검토하고 검증할 수 있도록 했습니다. 작성자에게 찬사를 보냅니다! 이 코드는 무료로 사용할 수 있지만, 코드를 재게시하는 경우 하우스 룰이 적용된다는 점을 기억하세요.
면책사항
해당 정보와 게시물은 금융, 투자, 트레이딩 또는 기타 유형의 조언이나 권장 사항으로 간주되지 않으며, 트레이딩뷰에서 제공하거나 보증하는 것이 아닙니다. 자세한 내용은 이용 약관을 참조하세요.