PROTECTED SOURCE SCRIPT
업데이트됨 Welivvinnlife & ocsabi03 OBV and GNL Hybrid Oscillator
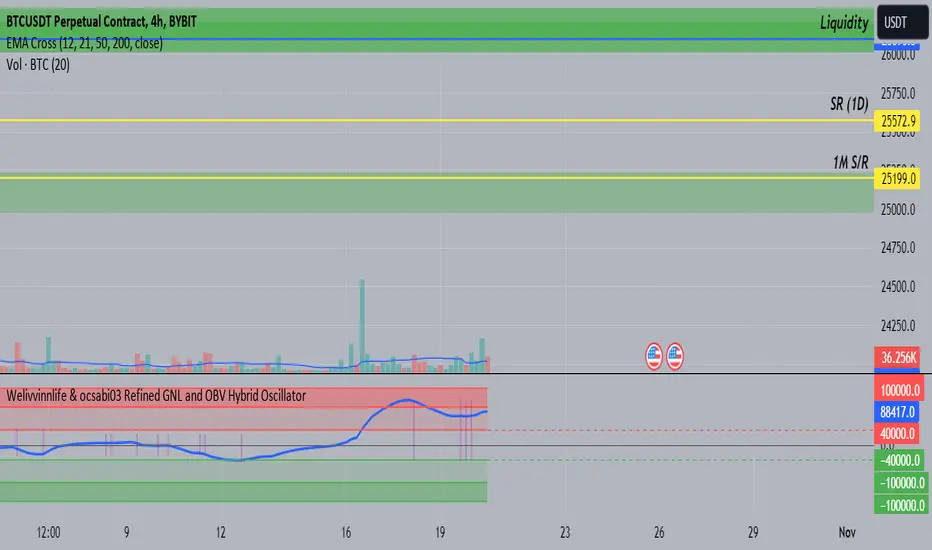
Signal Line (Blue): It gives a smoothed representation of the difference between OBV and GNL. When it moves upwards, it indicates that the recent differences between OBV and GNL are increasing, implying increased bullish momentum. When it moves downwards, it means that the differences are decreasing, suggesting increased bearish momentum.
The purple vertical lines are showing the inflection points of the blue line (if you want to see back in time use replay mode)
the green and red boxes ARE JUST VISUAL AIDS nothing else, not magic, those are the areas where a reversal can happen (not 100% of the time)
THIS IS NOT A MAGIC INDICATOR, ALWAYS USE THIS IN SOME KIND OF SYSTEM
릴리즈 노트
-보호된 스크립트입니다
이 스크립트는 비공개 소스로 게시됩니다. 하지만 제한 없이 자유롭게 사용할 수 있습니다 — 여기에서 자세히 알아보기.
면책사항
이 정보와 게시물은 TradingView에서 제공하거나 보증하는 금융, 투자, 거래 또는 기타 유형의 조언이나 권고 사항을 의미하거나 구성하지 않습니다. 자세한 내용은 이용 약관을 참고하세요.
면책사항
이 정보와 게시물은 TradingView에서 제공하거나 보증하는 금융, 투자, 거래 또는 기타 유형의 조언이나 권고 사항을 의미하거나 구성하지 않습니다. 자세한 내용은 이용 약관을 참고하세요.