OPEN-SOURCE SCRIPT
업데이트됨 TNT_Upgraded
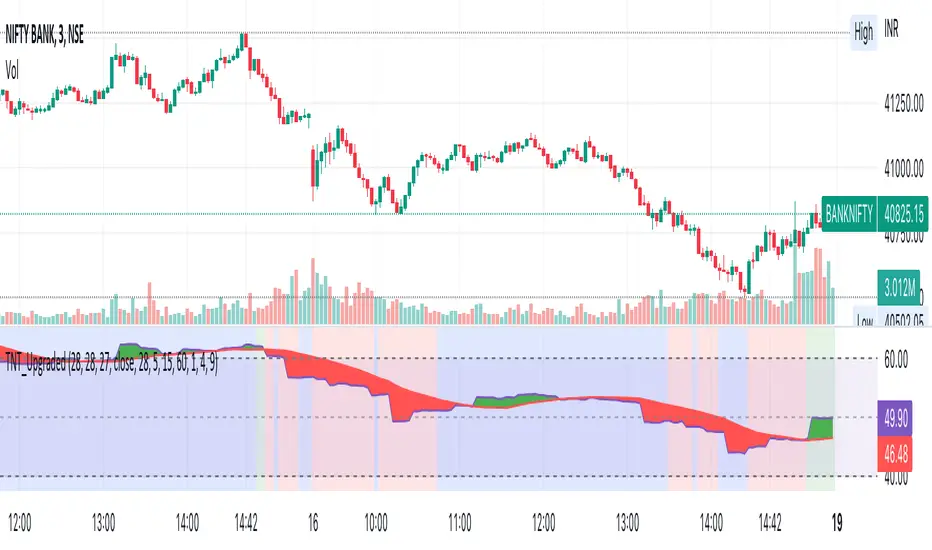
The background of the indicator to show TrendingUp (Green) / TrendingDown (Red) / Range Bound (Blue) Regions.
The concept is very simple, at each candle we look at the size of the candle and use a moving average of these candle body size (ABS (close-open)) and compare it agains a double smoothened average, i.e. moving average of this average to find trending or not trending periods.
In the upgrade the moving average is now looking only at the current day for intraday timeframe, i.e. in the first 5 bars it is an average of last 5 values, for last 10 candles it is an average of 10 values with the max limited to 28 that is for candle 28 onwards the average is always for 28 candles for default values or as defined by user.
I find it useful primarily for entry in options, a green background is more favourable for call option buying, a red background is favourable for put option buying and blue background is more favourable for option selling.
The coloured ranges show the direction bias, this has been designed using RSI on 3 timeframes with different weight-ages, all customisable by the user.
PS, I only trade Bank Nifty for intraday, all my observations are driven only by Bank Nifty.
릴리즈 노트
Minor code changes오픈 소스 스크립트
트레이딩뷰의 진정한 정신에 따라, 이 스크립트의 작성자는 이를 오픈소스로 공개하여 트레이더들이 기능을 검토하고 검증할 수 있도록 했습니다. 작성자에게 찬사를 보냅니다! 이 코드는 무료로 사용할 수 있지만, 코드를 재게시하는 경우 하우스 룰이 적용된다는 점을 기억하세요.
면책사항
해당 정보와 게시물은 금융, 투자, 트레이딩 또는 기타 유형의 조언이나 권장 사항으로 간주되지 않으며, 트레이딩뷰에서 제공하거나 보증하는 것이 아닙니다. 자세한 내용은 이용 약관을 참조하세요.
오픈 소스 스크립트
트레이딩뷰의 진정한 정신에 따라, 이 스크립트의 작성자는 이를 오픈소스로 공개하여 트레이더들이 기능을 검토하고 검증할 수 있도록 했습니다. 작성자에게 찬사를 보냅니다! 이 코드는 무료로 사용할 수 있지만, 코드를 재게시하는 경우 하우스 룰이 적용된다는 점을 기억하세요.
면책사항
해당 정보와 게시물은 금융, 투자, 트레이딩 또는 기타 유형의 조언이나 권장 사항으로 간주되지 않으며, 트레이딩뷰에서 제공하거나 보증하는 것이 아닙니다. 자세한 내용은 이용 약관을 참조하세요.