OPEN-SOURCE SCRIPT
Key Levels (4H and Daily)
Key Levels (4H and Daily)
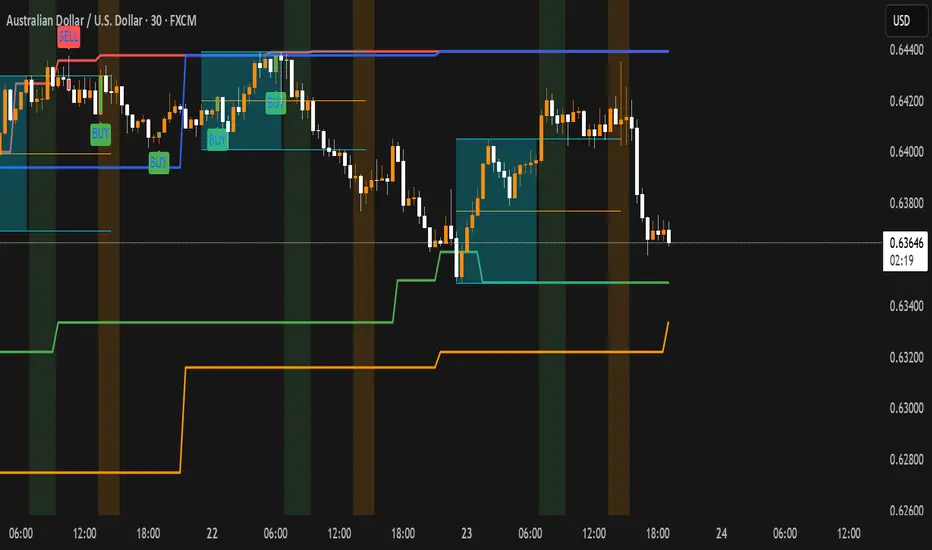
This indicator highlights important key price levels derived from the 4-hour (4H) and daily (D) timeframes, providing traders with critical support and resistance areas. The levels are calculated using the highest highs and lowest lows over a customizable lookback period, offering a dynamic view of significant price points that could influence market movement.
Key Features:
Key Levels for 4H and Daily Timeframes:
The indicator calculates and displays the highest high and lowest low over a user-defined period for both the 4-hour and daily timeframes. This helps traders identify key support and resistance levels that could dictate the market's behavior.
Customizable Lookback Period:
Traders can adjust the lookback period (in days) for both the 4-hour and daily timeframes to reflect different market conditions. This flexibility ensures the levels are tailored to your preferred trading style and market conditions.
Horizontal Lines:
The indicator plots horizontal lines at the high and low levels for both timeframes. These levels serve as dynamic support and resistance areas and help traders monitor price action near these critical points.
Real-Time Updates:
The lines adjust automatically with each new bar, providing up-to-date key levels based on the most recent price action and trading session.
Alert Conditions:
Alerts are built-in to notify traders when the price breaks above or below these key levels. Traders can set up notifications to stay informed when significant market moves occur.
How to Use:
Support and Resistance: Use the levels as potential support and resistance areas where price could reverse. Price often reacts at these levels, providing potential trading opportunities.
Breakouts: Pay attention to breakouts above the high or below the low of these levels. A break above the 4H or daily high could indicate bullish momentum, while a break below could signal bearish trends.
Trend Confirmation: Combine these levels with other technical analysis tools to confirm the overall market trend and enhance your trading strategy.
Perfect for:
Day Traders: Use the 4-hour levels for intraday trading setups, such as potential reversals or breakouts.
Swing Traders: The daily levels provide longer-term insights, helping to identify key zones where price might pause, reverse, or break out.
Market Context: Ideal for those who want to contextualize their trades within broader timeframes, helping to understand the market’s structure at multiple time scales.
This description conveys the utility and functionality of the indicator, focusing on how it helps traders identify and monitor key levels that influence market action.
오픈 소스 스크립트
트레이딩뷰의 진정한 정신에 따라, 이 스크립트의 작성자는 이를 오픈소스로 공개하여 트레이더들이 기능을 검토하고 검증할 수 있도록 했습니다. 작성자에게 찬사를 보냅니다! 이 코드는 무료로 사용할 수 있지만, 코드를 재게시하는 경우 하우스 룰이 적용된다는 점을 기억하세요.
면책사항
해당 정보와 게시물은 금융, 투자, 트레이딩 또는 기타 유형의 조언이나 권장 사항으로 간주되지 않으며, 트레이딩뷰에서 제공하거나 보증하는 것이 아닙니다. 자세한 내용은 이용 약관을 참조하세요.
오픈 소스 스크립트
트레이딩뷰의 진정한 정신에 따라, 이 스크립트의 작성자는 이를 오픈소스로 공개하여 트레이더들이 기능을 검토하고 검증할 수 있도록 했습니다. 작성자에게 찬사를 보냅니다! 이 코드는 무료로 사용할 수 있지만, 코드를 재게시하는 경우 하우스 룰이 적용된다는 점을 기억하세요.
면책사항
해당 정보와 게시물은 금융, 투자, 트레이딩 또는 기타 유형의 조언이나 권장 사항으로 간주되지 않으며, 트레이딩뷰에서 제공하거나 보증하는 것이 아닙니다. 자세한 내용은 이용 약관을 참조하세요.