INVITE-ONLY SCRIPT
Auto Harmonic Terhal
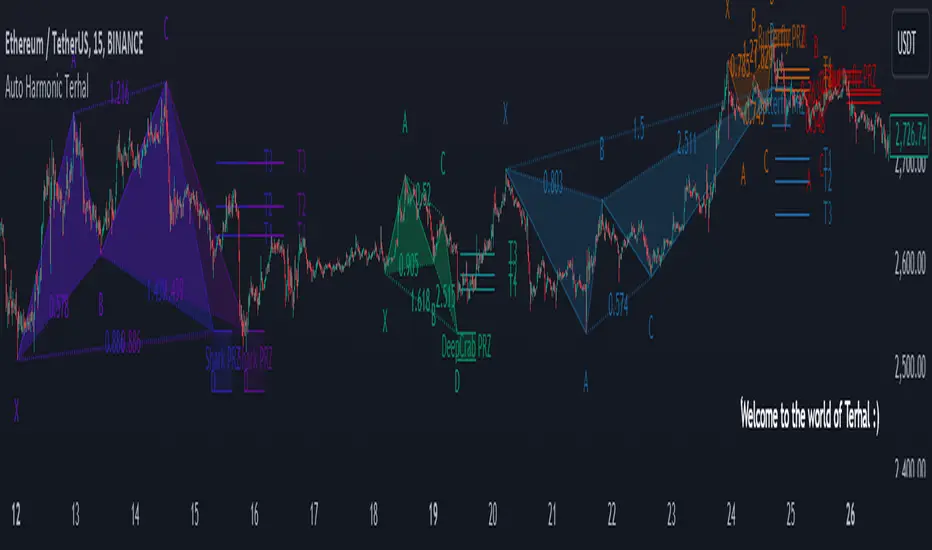
Auto Harmonic Terhal is an advanced harmonic pattern recognition indicator designed to identify a wide range of harmonic patterns and their corresponding Fibonacci retracement levels. This tool is equipped with all major harmonic patterns, including the Gartley, Bat, Crab, DeepCrab, Butterfly, and Shark patterns, along with their precise Fibonacci ratios derived from Scott Carney's Harmonic Trading framework.
Key Features:
Harmonic Patterns: The indicator supports all the essential harmonic patterns, each accompanied by their unique Fibonacci retracement levels, such as 0.382, 0.500, 0.618, 0.786, 0.886, 1.13, 1.618, and 1.902. These ratios are based on Scott Carney's studies.
Predictive and Conventional Usage: The Auto Harmonic Terhal can be used in two ways:
-Predictive: Traders can anticipate harmonic patterns before they are fully formed, allowing them to set up trades in advance.
Conventional: The indicator confirms patterns once they appear, making it a useful tool for pattern validation.
-Accurate Targets: Once a pattern is identified, the indicator displays target levels based on correct Fibonacci ratios, helping traders to locate potential price reversal points and profit targets.
Multi-Zigzag Functionality: The indicator scans for patterns across multiple zigzag configurations, enhancing the detection of different harmonic structures without limiting itself to a single timeframe or zigzag structure.
Fibonacci Ratios for Patterns:
Gartley: XA retracement 61.8%, AB between 0.618 and 0.786, CD 1.272 extension.
Bat: XA retracement 50%, AB 38.2% to 50%, CD 88.6%.
Crab: XA retracement 38.2%, CD extension 161.8%.
Deep Crab: XA retracement 88.6%, CD extension 161.8%.
Butterfly: XA retracement 78.6%, CD extension 127% to 161.8%.
Shark: AB 113% to 161.8%, CD 88.6%.
This indicator serves as a crucial aid for harmonic pattern analysis and supports an essential form of technical analysis. However, it does not recommend buying or selling or making any trade decisions directly. It is meant to assist in harmonic analysis for traders, providing a framework for understanding market reversals and structure.
Note: The tool is intended as a technical analysis assistant and does not provide direct buy or sell signals.
초대 전용 스크립트
이 스크립트는 작성자가 승인한 사용자만 접근할 수 있습니다. 사용하려면 요청 후 승인을 받아야 하며, 일반적으로 결제 후에 허가가 부여됩니다. 자세한 내용은 아래 작성자의 안내를 따르거나 Bit_Terhal에게 직접 문의하세요.
트레이딩뷰는 스크립트의 작동 방식을 충분히 이해하고 작성자를 완전히 신뢰하지 않는 이상, 해당 스크립트에 비용을 지불하거나 사용하는 것을 권장하지 않습니다. 커뮤니티 스크립트에서 무료 오픈소스 대안을 찾아보실 수도 있습니다.
작성자 지시 사항
direct message "tradingview ".. thank you
면책사항
해당 정보와 게시물은 금융, 투자, 트레이딩 또는 기타 유형의 조언이나 권장 사항으로 간주되지 않으며, 트레이딩뷰에서 제공하거나 보증하는 것이 아닙니다. 자세한 내용은 이용 약관을 참조하세요.