PROTECTED SOURCE SCRIPT
TRADE ORBIT:-Average Directional Index with Color Zones
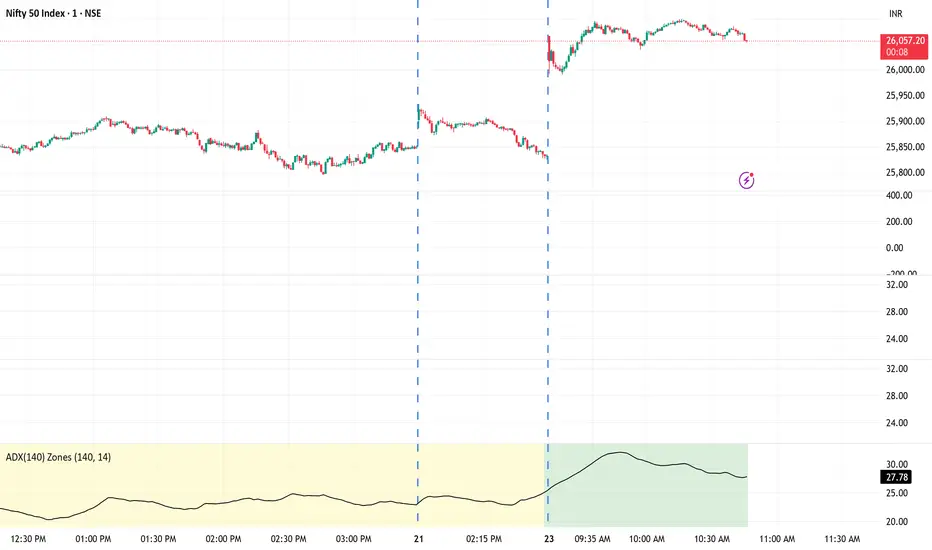
This indicator is a long-term smoothed version of the Average Directional Index (ADX) designed to measure trend strength while filtering out short-term noise.
It applies a 140-period smoothing to the ADX calculation, making it ideal for swing or positional traders who want to identify sustained trends rather than short-lived moves.
🎯 How It Works
The ADX(140) measures the strength of the current trend, regardless of direction.
The background color automatically changes based on the ADX value range to visually highlight the market condition.
ADX Range Background Color Interpretation
0–25 🟡 Yellow Weak trend / ranging market
25–50 🟢 Green Moderate trend strength
50–75 🔵 Blue Strong trend
75–100 🔴 Red Very strong / overheated trend
Horizontal reference lines are also plotted at 0, 25, 50, 75, and 100 to make the trend zones clear.
보호된 스크립트입니다
이 스크립트는 비공개 소스로 게시됩니다. 하지만 제한 없이 자유롭게 사용할 수 있습니다 — 여기에서 자세히 알아보기.
면책사항
이 정보와 게시물은 TradingView에서 제공하거나 보증하는 금융, 투자, 거래 또는 기타 유형의 조언이나 권고 사항을 의미하거나 구성하지 않습니다. 자세한 내용은 이용 약관을 참고하세요.
보호된 스크립트입니다
이 스크립트는 비공개 소스로 게시됩니다. 하지만 제한 없이 자유롭게 사용할 수 있습니다 — 여기에서 자세히 알아보기.
면책사항
이 정보와 게시물은 TradingView에서 제공하거나 보증하는 금융, 투자, 거래 또는 기타 유형의 조언이나 권고 사항을 의미하거나 구성하지 않습니다. 자세한 내용은 이용 약관을 참고하세요.