OPEN-SOURCE SCRIPT
업데이트됨 Stochastic RSI with crossover-indication and alerts
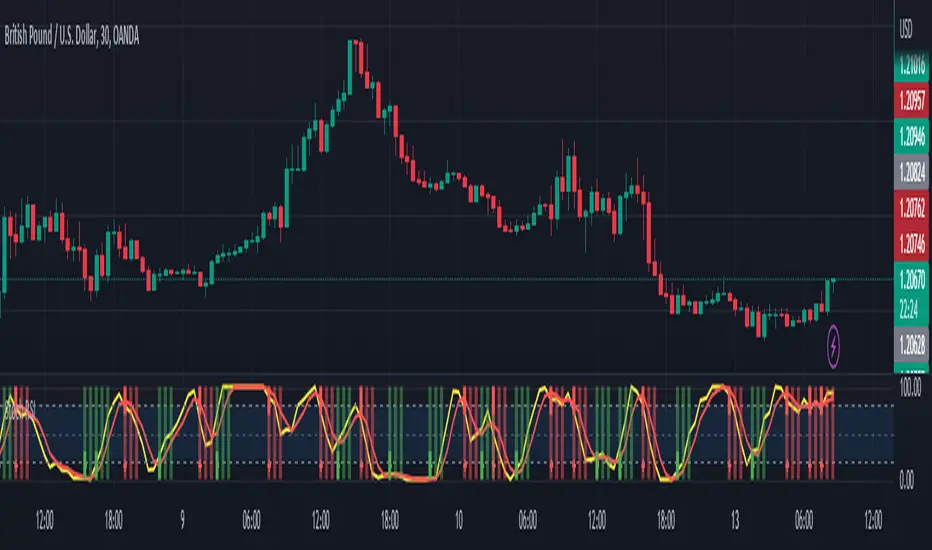
On the normal Stochastic RSI it may be hard to see the exact crosses between the two lines. This version makes that a little easier.
Shows green line when K-line crosses up the D-line, but below the 50-level (this treshold level can be adjusted in the settings).
Shows red line when K-line crosses down the D-line, but above the 50-level (treshold level can be adjusted).
Option to show lines on the subsequent one or two bars. For instance you can use a rule that a crossover is still valid for trade-entry when it happened 2 bars ago.
릴리즈 노트
Cleaned up the code.Linewidth can now be adjusted.
In the style-settings you can get rid of the vertical lines, leaving just a tiny cross as an indication where the K and D have crossed.
릴리즈 노트
New version can generate alerts with crossover / crossunder,but with additional condition that candle itself is bulllish (green) or bearish (red).릴리즈 노트
.오픈 소스 스크립트
트레이딩뷰의 진정한 정신에 따라, 이 스크립트의 작성자는 이를 오픈소스로 공개하여 트레이더들이 기능을 검토하고 검증할 수 있도록 했습니다. 작성자에게 찬사를 보냅니다! 이 코드는 무료로 사용할 수 있지만, 코드를 재게시하는 경우 하우스 룰이 적용된다는 점을 기억하세요.
면책사항
해당 정보와 게시물은 금융, 투자, 트레이딩 또는 기타 유형의 조언이나 권장 사항으로 간주되지 않으며, 트레이딩뷰에서 제공하거나 보증하는 것이 아닙니다. 자세한 내용은 이용 약관을 참조하세요.
오픈 소스 스크립트
트레이딩뷰의 진정한 정신에 따라, 이 스크립트의 작성자는 이를 오픈소스로 공개하여 트레이더들이 기능을 검토하고 검증할 수 있도록 했습니다. 작성자에게 찬사를 보냅니다! 이 코드는 무료로 사용할 수 있지만, 코드를 재게시하는 경우 하우스 룰이 적용된다는 점을 기억하세요.
면책사항
해당 정보와 게시물은 금융, 투자, 트레이딩 또는 기타 유형의 조언이나 권장 사항으로 간주되지 않으며, 트레이딩뷰에서 제공하거나 보증하는 것이 아닙니다. 자세한 내용은 이용 약관을 참조하세요.