OPEN-SOURCE SCRIPT
Multi-Timeframe VWAP Strategy [JARUTIR]
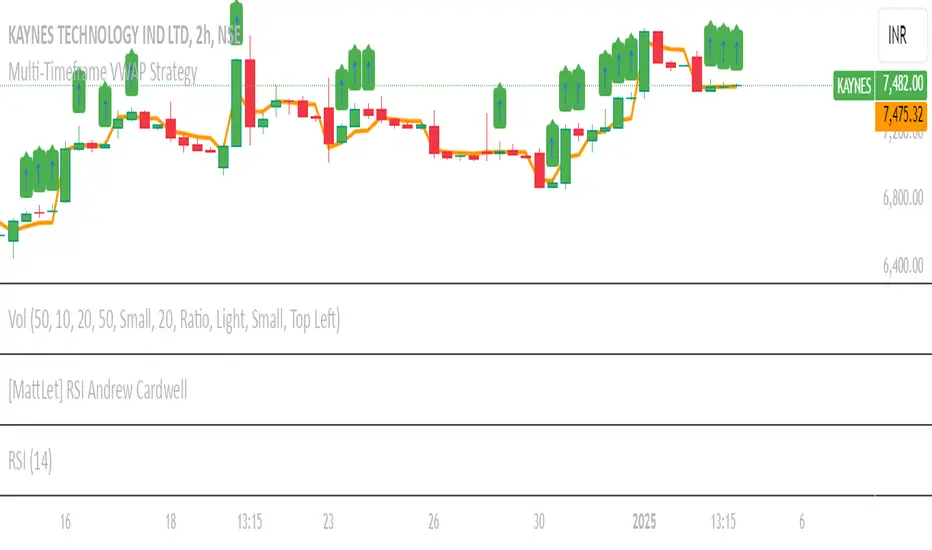
Multi-Timeframe VWAP with Price Above VWAP Marker
This indicator allows you to view the Volume-Weighted Average Price (VWAP) across multiple timeframes on a single chart. The VWAP is a popular technical analysis tool used by traders to determine the average price of an asset weighted by volume. It helps identify the overall market trend and is especially useful for intraday trading.
Key Features:
Multiple Timeframes: Choose from 1-minute, 5-minute, 15-minute, 30-minute, 1-hour, and 1-day VWAPs. You can enable or disable the VWAP for any timeframe based on your preference.
Customizable: Easily toggle on/off the VWAP for each timeframe via checkboxes in the settings.
Price Above VWAP Marker: A clear green up arrow is displayed above the price bar whenever the price is above the current VWAP, helping you quickly spot potential bullish signals.
Flexible & Easy to Use: Adjust the settings for any timeframe and see the VWAPs on your chart without clutter. Whether you are trading in the short term or analyzing longer-term trends, this tool provides you with the flexibility you need.
How to Use:
VWAP as Trend Indicator: The VWAP is commonly used to identify whether the price is trending above or below the average price for the session. Price above the VWAP generally signals bullish momentum, while price below the VWAP can indicate bearish pressure.
Price Above VWAP Marker: The green up arrow is your signal for when the price is above the VWAP, which can be used as a potential entry point for long trades.
Customize Timeframes: Whether you're focusing on ultra-short-term movements (like 1-min or 5-min) or need a broader view (like 1-hour or 1-day), this indicator lets you tailor the analysis to your preferred time horizon.
Ideal For:
Intraday Traders looking for quick signals on different timeframes.
Swing Traders who want to track the overall market trend with multiple VWAP levels.
Scalpers needing to monitor fast price movements alongside volume-weighted averages
오픈 소스 스크립트
트레이딩뷰의 진정한 정신에 따라, 이 스크립트의 작성자는 이를 오픈소스로 공개하여 트레이더들이 기능을 검토하고 검증할 수 있도록 했습니다. 작성자에게 찬사를 보냅니다! 이 코드는 무료로 사용할 수 있지만, 코드를 재게시하는 경우 하우스 룰이 적용된다는 점을 기억하세요.
면책사항
해당 정보와 게시물은 금융, 투자, 트레이딩 또는 기타 유형의 조언이나 권장 사항으로 간주되지 않으며, 트레이딩뷰에서 제공하거나 보증하는 것이 아닙니다. 자세한 내용은 이용 약관을 참조하세요.
오픈 소스 스크립트
트레이딩뷰의 진정한 정신에 따라, 이 스크립트의 작성자는 이를 오픈소스로 공개하여 트레이더들이 기능을 검토하고 검증할 수 있도록 했습니다. 작성자에게 찬사를 보냅니다! 이 코드는 무료로 사용할 수 있지만, 코드를 재게시하는 경우 하우스 룰이 적용된다는 점을 기억하세요.
면책사항
해당 정보와 게시물은 금융, 투자, 트레이딩 또는 기타 유형의 조언이나 권장 사항으로 간주되지 않으며, 트레이딩뷰에서 제공하거나 보증하는 것이 아닙니다. 자세한 내용은 이용 약관을 참조하세요.