OPEN-SOURCE SCRIPT
업데이트됨 WaveTrend [LazyBear] vX by DGT

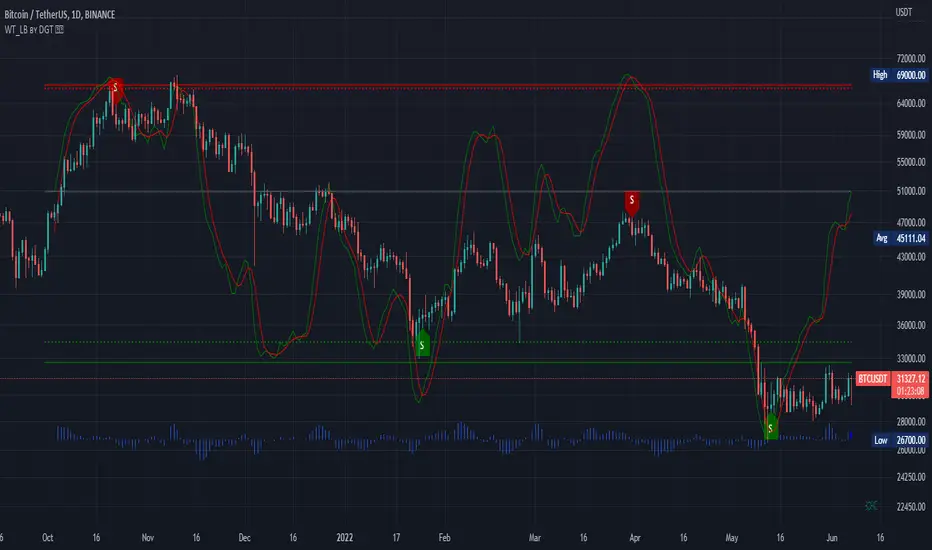
DGT interpreted version of LazyBear's WaveTrend, visualizing on Price Chart
Original Author : LazyBear
Crosses above or below threshold are emphasized with bigger labels
- crosses above threshold : probable short indications with a bigger label and relativly small label for probable long indications
- crosses below threshold : probable long indications with a bigger label and relativly small label for probable short indications
All rest crosses within threshold boundaries with relatively small labels for both long and short probable indications
릴리즈 노트
small update : alert condition added릴리즈 노트
update thanks to sandyrindal suggestions, special thanks to himadded ability to change the signal length
added ability to compare with other symbols, can be symbols that are directly correlated or inversely correlated symbols
Here is the modified code for the ones who enjoy the WaveTrend Oscillator on separate pane
//@version=4
//@author LazyBear, modified by dgtrd
study(title="WaveTrend [LazyBear]", shorttitle="WT_LB vX ʙʏ DGT ☼☾")
n1 = input(10, "Length : Channel ", inline = "LEN")
n2 = input(21, "Average", inline = "LEN")
s1 = input(4 , "Signal Length")
obLevel1 = input( 60, "Over Bought Level 1", inline = "OB")
obLevel2 = input( 53, "Level 2" , inline = "OB")
osLevel1 = input(-60, "Over Sold Level 1" , inline = "OS")
osLevel2 = input(-53, "Level 2" , inline = "OS")
f_getWT(s) =>
ap = s
esa = ema(ap, n1)
d = ema(abs(ap - esa), n1)
ci = (ap - esa) / (0.015 * d)
tci = ema(ci, n2)
wt1 = tci
wt2 = sma(wt1, s1)
[wt1, wt2]
plot(0 , color=color.gray )
plot(obLevel1, color=color.red )
plot(osLevel1, color=color.green)
plot(obLevel2, color=color.red , style=3)
plot(osLevel2, color=color.green, style=3)
[wt1, wt2] = f_getWT(hlc3)
plot(wt1 , color=color.green)
plot(wt2 , color=color.red , style=3)
plot(wt1-wt2, color=color.blue , style=plot.style_area, transp=80)
compare = input(false, "Compare with Symbol", inline = "CPR")
symbol = input("CBOE:VIX" , "", type=input.symbol, inline = "CPR")
extSrc = security (symbol , timeframe.period, hlc3, barmerge.gaps_off, barmerge.lookahead_on)
[wt1x, wt2x] = f_getWT(extSrc)
plot(compare ? wt1x : na, color=color.aqua)
plot(compare ? wt2x : na, color=color.yellow, style=3)
plot(compare ? wt1x-wt2x : na, color=color.olive, style=plot.style_area, transp=80)
릴리즈 노트
added a label to display current values of the wavetrend and signal level 릴리즈 노트
Update* overlay wavetrand display addition, better interpretation
* enhanced signal customizations
Similar Indicators
Oscillators Overlay w/ Divergencies/Alerts : Oscillators-Overlay-with-Divergencies-Alerts
Elliott Wave Oscillator Signals : EWO-Signals
오픈 소스 스크립트
트레이딩뷰의 진정한 정신에 따라, 이 스크립트의 작성자는 이를 오픈소스로 공개하여 트레이더들이 기능을 검토하고 검증할 수 있도록 했습니다. 작성자에게 찬사를 보냅니다! 이 코드는 무료로 사용할 수 있지만, 코드를 재게시하는 경우 하우스 룰이 적용된다는 점을 기억하세요.
Premium Indicators – Try Free for 15 Days: sites.google.com/view/solemare-analytics
면책사항
해당 정보와 게시물은 금융, 투자, 트레이딩 또는 기타 유형의 조언이나 권장 사항으로 간주되지 않으며, 트레이딩뷰에서 제공하거나 보증하는 것이 아닙니다. 자세한 내용은 이용 약관을 참조하세요.