OPEN-SOURCE SCRIPT
Best Time Slots — Auto-Adapt (v6, TF-safe) + Range Alerts
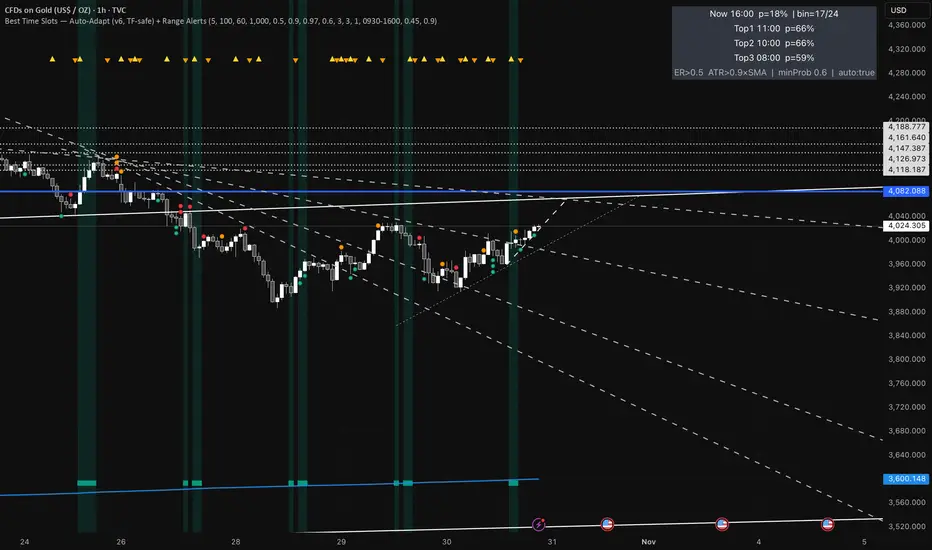
Time & binning
Auto-adapt to timeframe
Makes all time windows scale to your chart’s bar size (so it “just works” on 1m, 15m, 4H, Daily).
• On = recommended. • Off = fixed default lengths.
Minimum Bin (minutes)
The size of each daily time slot we track (e.g., 5-min bins). The script uses the larger of this and your bar size.
• Higher = fewer, broader slots; smoother stats. • Lower = more, narrower slots; needs more history.
• Try: 5–15 on intraday, 60–240 on higher TFs.
Lookback windows (used when Auto-adapt = ON)
Target ER Window (minutes)
How far back we look to judge Efficiency Ratio (how “straight” the move was).
• Higher = stricter/smoother; fewer bars qualify as “movement”. • Lower = more sensitive.
• Try: 60–120 min intraday; 240–600 min for higher TFs.
Target ATR Window (minutes)
How far back we compute ATR (typical range).
• Higher = steadier ATR baseline. • Lower = reacts faster.
• Try: 30–120 min intraday; 240–600 min higher TFs.
Target Normalization Window (minutes)
How far back for the average ATR (the baseline we compare to).
• Higher = stricter “above average range” check. • Lower = easier to pass.
• Try: ~500–1500 min.
What counts as “movement”
ER Threshold (0–1)
Minimum efficiency a bar must have to count as movement.
• Higher = only very “clean, one-direction” bars count. • Lower = more bars count.
• Try: 0.55–0.65. (0.60 = balanced.)
ATR Floor vs SMA(ATR)
Requires range to be at least this many × average ATR.
• Higher (e.g., 1.2) = demand bigger-than-usual ranges. • Lower (e.g., 0.9) = allow smaller ranges.
• Try: 1.0 (above average).
How history is averaged
Recent Days Weight (per-day decay)
Gives more weight to recent days. Example: 0.97 ≈ each day old counts ~3% less.
• Higher (0.99) = slower fade (older days matter more). • Lower (0.95) = faster fade.
• Try: 0.97–0.99.
Laplace Prior Seen / Laplace Prior Hit
“Starter counts” so early stats aren’t crazy when you have little data.
• Higher priors = probabilities start closer to average; need more real data to move.
• Try: Seen=3, Hit=1 (defaults).
Min Samples (effective)
Don’t highlight a slot unless it has at least this many effective samples (after decay + priors).
• Higher = safer, but fewer highlights early.
• Try: 3–10.
When to highlight on the chart
Min Probability to Highlight
We shade/mark bars only if their slot’s historical movement probability is ≥ this.
• Higher = pickier, fewer highlights. • Lower = more highlights.
• Try: 0.45–0.60.
Show Markers on Good Bins
Draws a small square on bars that fall in a “good” slot (in addition to the soft background).
Limit to market hours (optional)
Restrict to Session + Session
Only learn/score inside this time window (e.g., “0930-1600”). Uses the chart/exchange timezone.
• Turn on if you only care about RTH.
Range (chop) alerts
Range START if ER ≤
Triggers range when efficiency drops below this level (price starts zig-zagging).
• Higher = easier to call “range”. • Lower = stricter.
Range START if ATR ≤ this × SMA(ATR)
Also triggers range when ATR shrinks below this fraction of its average (volatility contraction).
• Higher (e.g., 1.0) = stricter (must be at/under average). • Lower (e.g., 0.9) = easier to call range.
Alerts on bar close
If ON, alerts fire once per bar close (cleaner). If OFF, they can trigger intrabar (faster, noisier).
Quick “what happens if I change X?”
Want more highlighted times? ↓ Min Probability, ↓ ER Threshold, or ↓ ATR Floor (e.g., 0.9).
Want stricter highlights? ↑ Min Probability, ↑ ER Threshold, or ↑ ATR Floor (e.g., 1.2).
Want recent days to matter more? ↑ Recent Days Weight toward 0.99.
On 4H/Daily, widen Minimum Bin (e.g., 60–240) and maybe lower Min Probability a bit.
오픈 소스 스크립트
트레이딩뷰의 진정한 정신에 따라, 이 스크립트의 작성자는 이를 오픈소스로 공개하여 트레이더들이 기능을 검토하고 검증할 수 있도록 했습니다. 작성자에게 찬사를 보냅니다! 이 코드는 무료로 사용할 수 있지만, 코드를 재게시하는 경우 하우스 룰이 적용된다는 점을 기억하세요.
면책사항
해당 정보와 게시물은 금융, 투자, 트레이딩 또는 기타 유형의 조언이나 권장 사항으로 간주되지 않으며, 트레이딩뷰에서 제공하거나 보증하는 것이 아닙니다. 자세한 내용은 이용 약관을 참조하세요.
오픈 소스 스크립트
트레이딩뷰의 진정한 정신에 따라, 이 스크립트의 작성자는 이를 오픈소스로 공개하여 트레이더들이 기능을 검토하고 검증할 수 있도록 했습니다. 작성자에게 찬사를 보냅니다! 이 코드는 무료로 사용할 수 있지만, 코드를 재게시하는 경우 하우스 룰이 적용된다는 점을 기억하세요.
면책사항
해당 정보와 게시물은 금융, 투자, 트레이딩 또는 기타 유형의 조언이나 권장 사항으로 간주되지 않으며, 트레이딩뷰에서 제공하거나 보증하는 것이 아닙니다. 자세한 내용은 이용 약관을 참조하세요.