OPEN-SOURCE SCRIPT
APEX - RSI with MA [v1]
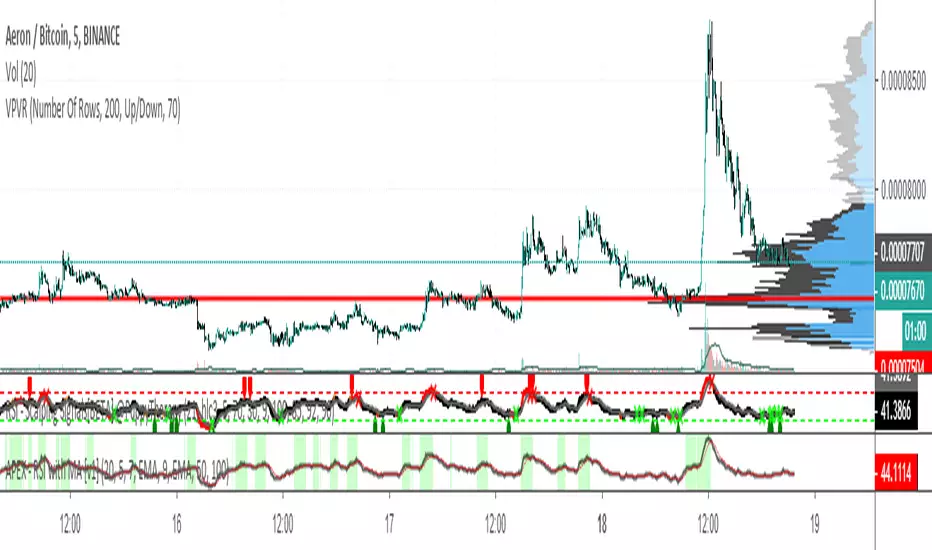
The Relative Strength Index (RSI) is as a momentum oscillator originally developed by J. Welles Wilder. The indicator is calculated as a Ratio of higher closes to lower closes on a scale of 0 to 100.
If the indicator reaches values above 80 (some use 70 or 75) it means the instrument is overbought and if the values are below 20 (25 or 30) it is oversold. But be aware those are just terms oversold/overbought main oversold /overbought for a long time. In general values over 50 mean your instrument is in a bullish state and below 50 it is in a bearish state.
The indicator is most commonly used with the length of 14. Some use RSI in a much more aggressive manner with the length of 2 (also known as Connors RSI). Whereas others have used length up to 20.
Use greater length values on the lower the timeframe to help with the noise. On larger time frames, you should be looking at lower length values.
오픈 소스 스크립트
트레이딩뷰의 진정한 정신에 따라, 이 스크립트의 작성자는 이를 오픈소스로 공개하여 트레이더들이 기능을 검토하고 검증할 수 있도록 했습니다. 작성자에게 찬사를 보냅니다! 이 코드는 무료로 사용할 수 있지만, 코드를 재게시하는 경우 하우스 룰이 적용된다는 점을 기억하세요.
면책사항
해당 정보와 게시물은 금융, 투자, 트레이딩 또는 기타 유형의 조언이나 권장 사항으로 간주되지 않으며, 트레이딩뷰에서 제공하거나 보증하는 것이 아닙니다. 자세한 내용은 이용 약관을 참조하세요.
오픈 소스 스크립트
트레이딩뷰의 진정한 정신에 따라, 이 스크립트의 작성자는 이를 오픈소스로 공개하여 트레이더들이 기능을 검토하고 검증할 수 있도록 했습니다. 작성자에게 찬사를 보냅니다! 이 코드는 무료로 사용할 수 있지만, 코드를 재게시하는 경우 하우스 룰이 적용된다는 점을 기억하세요.
면책사항
해당 정보와 게시물은 금융, 투자, 트레이딩 또는 기타 유형의 조언이나 권장 사항으로 간주되지 않으며, 트레이딩뷰에서 제공하거나 보증하는 것이 아닙니다. 자세한 내용은 이용 약관을 참조하세요.