OPEN-SOURCE SCRIPT
업데이트됨 Support/Resistance v2 (ML) Kmean
Kmean with Standard Deviation Channel
1. Description of Kmean
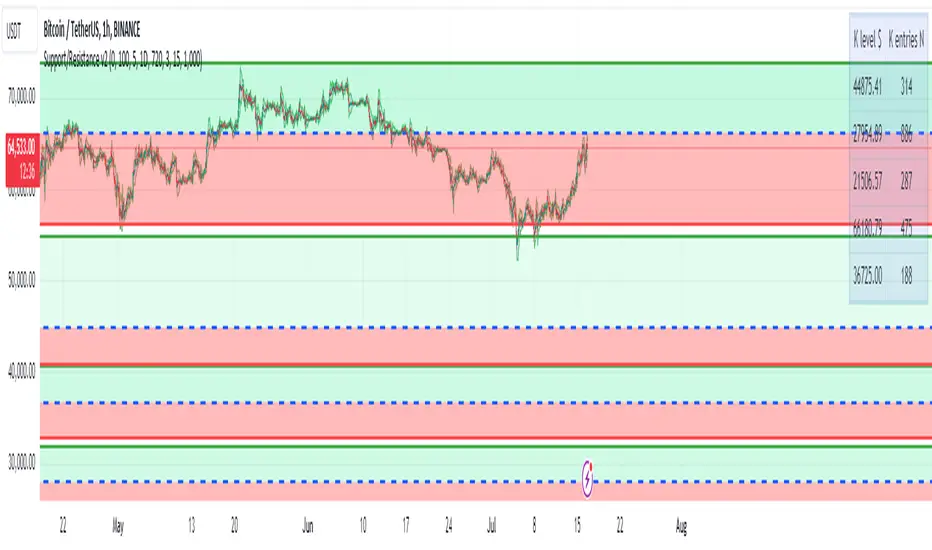
Kmean (or K-means) is a popular clustering algorithm used to divide data into K groups based on their similarity. In the context of financial markets, Kmean can be applied to find the average price values over a specific period, allowing the identification of major trends and levels of support and resistance.
2. Application in Trading
In trading, Kmean is used to smooth out the price series and determine long-term trends. This helps traders make more informed decisions by avoiding noise and short-term fluctuations. Kmean can serve as a baseline around which other analytical tools, such as channels and bands, are constructed.
3. Description of Standard Deviation (stdev)
Standard deviation (stdev) is a statistical measure that indicates how much the values of data deviate from their mean value. In finance, standard deviation is often used to assess price volatility. A high standard deviation indicates strong price fluctuations, while a low standard deviation indicates stable movements.
4. Combining Kmean and Standard Deviation to Predict Short-Term Price Behavior
Combining Kmean and standard deviation creates a powerful tool for analyzing market conditions. Kmean shows the average price trend, while the standard deviation channels demonstrate the boundaries within which the price can fluctuate. This combination helps traders to:
Should you have any questions about code, please reach me at Tradingview directly.
Hope you find this script helpful!
1. Description of Kmean
Kmean (or K-means) is a popular clustering algorithm used to divide data into K groups based on their similarity. In the context of financial markets, Kmean can be applied to find the average price values over a specific period, allowing the identification of major trends and levels of support and resistance.
2. Application in Trading
In trading, Kmean is used to smooth out the price series and determine long-term trends. This helps traders make more informed decisions by avoiding noise and short-term fluctuations. Kmean can serve as a baseline around which other analytical tools, such as channels and bands, are constructed.
3. Description of Standard Deviation (stdev)
Standard deviation (stdev) is a statistical measure that indicates how much the values of data deviate from their mean value. In finance, standard deviation is often used to assess price volatility. A high standard deviation indicates strong price fluctuations, while a low standard deviation indicates stable movements.
4. Combining Kmean and Standard Deviation to Predict Short-Term Price Behavior
Combining Kmean and standard deviation creates a powerful tool for analyzing market conditions. Kmean shows the average price trend, while the standard deviation channels demonstrate the boundaries within which the price can fluctuate. This combination helps traders to:
- Identify support and resistance levels.
- Predict potential price reversals.
- Assess risks and set stop-losses and take-profits.
Should you have any questions about code, please reach me at Tradingview directly.
Hope you find this script helpful!
릴리즈 노트
Kmean with Standard Deviation Channel1. Description of Kmean
Kmean (or K-means) is a popular clustering algorithm used to divide data into K groups based on their similarity. In the context of financial markets, Kmean can be applied to find the average price values over a specific period, allowing the identification of major trends and levels of support and resistance.
2. Application in Trading
In trading, Kmean is used to smooth out the price series and determine long-term trends. This helps traders make more informed decisions by avoiding noise and short-term fluctuations. Kmean can serve as a baseline around which other analytical tools, such as channels and bands, are constructed.
3. Description of Standard Deviation (stdev)
Standard deviation (stdev) is a statistical measure that indicates how much the values of data deviate from their mean value. In finance, standard deviation is often used to assess price volatility. A high standard deviation indicates strong price fluctuations, while a low standard deviation indicates stable movements.
4. Combining Kmean and Standard Deviation to Predict Short-Term Price Behavior
Combining Kmean and standard deviation creates a powerful tool for analyzing market conditions. Kmean shows the average price trend, while the standard deviation channels demonstrate the boundaries within which the price can fluctuate. This combination helps traders to:
Identify support and resistance levels.
Predict potential price reversals.
Assess risks and set stop-losses and take-profits.
Should you have any questions about code, please reach me at Tradingview directly.
Hope you find this script helpful!
릴리즈 노트
Additional description:In this case, we are looking for strong clusters where the midpoint is near the upper or lower point of the cluster. The colors are represented by a gradient and become more transparent as the midpoint moves farther from the upper or lower point.
Using shifted standard deviation (STDEV), we can determine when the price may touch the value that lies between two clusters or the midpoint, enabling us to trade channels or reversal patterns.
오픈 소스 스크립트
트레이딩뷰의 진정한 정신에 따라, 이 스크립트의 작성자는 이를 오픈소스로 공개하여 트레이더들이 기능을 검토하고 검증할 수 있도록 했습니다. 작성자에게 찬사를 보냅니다! 이 코드는 무료로 사용할 수 있지만, 코드를 재게시하는 경우 하우스 룰이 적용된다는 점을 기억하세요.
면책사항
해당 정보와 게시물은 금융, 투자, 트레이딩 또는 기타 유형의 조언이나 권장 사항으로 간주되지 않으며, 트레이딩뷰에서 제공하거나 보증하는 것이 아닙니다. 자세한 내용은 이용 약관을 참조하세요.
오픈 소스 스크립트
트레이딩뷰의 진정한 정신에 따라, 이 스크립트의 작성자는 이를 오픈소스로 공개하여 트레이더들이 기능을 검토하고 검증할 수 있도록 했습니다. 작성자에게 찬사를 보냅니다! 이 코드는 무료로 사용할 수 있지만, 코드를 재게시하는 경우 하우스 룰이 적용된다는 점을 기억하세요.
면책사항
해당 정보와 게시물은 금융, 투자, 트레이딩 또는 기타 유형의 조언이나 권장 사항으로 간주되지 않으며, 트레이딩뷰에서 제공하거나 보증하는 것이 아닙니다. 자세한 내용은 이용 약관을 참조하세요.