Provides a unique and visually stunning way to analyze the similarity between various stock market indices. This script uses a range of mathematical measures to calculate the correlation between different assets, such as indices, forex, crypto, etc..
Key Features:
How it Works:
Visual Insights:
Overall, MASM is a powerful tool for market analysis and visualization, offering a unique perspective on the relationships between various assets.
~llama3
Key Features:
- Similarity Measures: The script offers a range of similarity measures to choose from, including SSD (Sum of Squared Differences), Euclidean Distance, Manhattan Distance, Minkowski Distance, Chebyshev Distance, Correlation Coefficient, Cosine Similarity, Camberra Index, Mean Absolute Error (MAE), Mean Squared Error (MSE), Lorentzian Function, Intersection, and Penrose Shape.
- Asset Selection: Users can select the assets they want to analyze by entering a comma-separated list of tickers in the "Asset List" input field.
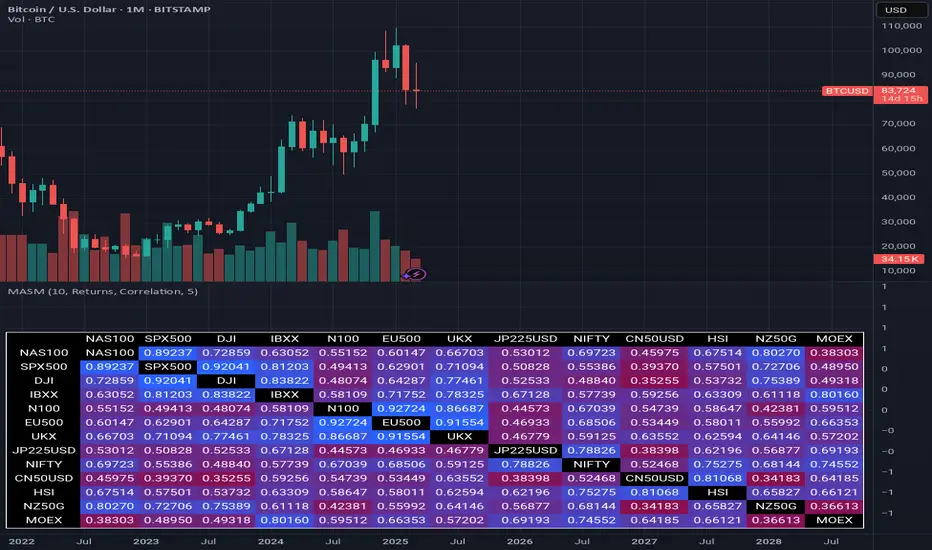
- Color Gradient: The script uses a color gradient to represent the similarity values between each pair of indices, with red indicating low similarity and blue indicating high similarity.
How it Works:
- The script calculates the source method (Returns or Volume Modified Returns) for each index using the sec function.
- It then creates a matrix to hold the current values of each index over a specified window size (default is 10).
- For each pair of indices, it applies the selected similarity measure using the select function and stores the result in a separate matrix.
- The script calculates the maximum and minimum values of the similarity matrix to normalize the color gradient.
- Finally, it creates a table with the index names as rows and columns, displaying the similarity values for each pair of indices using the calculated colors.
Visual Insights:
- The indicator provides an intuitive way to visualize the relationships between different assets.
- By analyzing the color-coded tables, traders can gain insights into:
- Which assets are highly correlated (blue) or uncorrelated (red)
- The strength and direction of these correlations
- Potential trading opportunities based on similarities and differences between assets
Overall, MASM is a powerful tool for market analysis and visualization, offering a unique perspective on the relationships between various assets.
~llama3
릴리즈 노트
Added asset name to the diagonal cells, optional number of digits.릴리즈 노트
Update chart image.릴리즈 노트
Fixed a issue with the gradient color selection.릴리즈 노트
Fixed a issue with the correlation, thanks to: truongnldangky, scorpion1405 for noticing.오픈 소스 스크립트
트레이딩뷰의 진정한 정신에 따라, 이 스크립트의 작성자는 이를 오픈소스로 공개하여 트레이더들이 기능을 검토하고 검증할 수 있도록 했습니다. 작성자에게 찬사를 보냅니다! 이 코드는 무료로 사용할 수 있지만, 코드를 재게시하는 경우 하우스 룰이 적용된다는 점을 기억하세요.
면책사항
해당 정보와 게시물은 금융, 투자, 트레이딩 또는 기타 유형의 조언이나 권장 사항으로 간주되지 않으며, 트레이딩뷰에서 제공하거나 보증하는 것이 아닙니다. 자세한 내용은 이용 약관을 참조하세요.
오픈 소스 스크립트
트레이딩뷰의 진정한 정신에 따라, 이 스크립트의 작성자는 이를 오픈소스로 공개하여 트레이더들이 기능을 검토하고 검증할 수 있도록 했습니다. 작성자에게 찬사를 보냅니다! 이 코드는 무료로 사용할 수 있지만, 코드를 재게시하는 경우 하우스 룰이 적용된다는 점을 기억하세요.
면책사항
해당 정보와 게시물은 금융, 투자, 트레이딩 또는 기타 유형의 조언이나 권장 사항으로 간주되지 않으며, 트레이딩뷰에서 제공하거나 보증하는 것이 아닙니다. 자세한 내용은 이용 약관을 참조하세요.