INVITE-ONLY SCRIPT
ML Pattern Dynamics
ML Pattern Dynamics
The indicator "ML Pattern Dynamics" for Tradingview, tailored specifically for traders and investors, harnesses the collective intelligence of KNN to provide accurate predictions. Stay one step ahead of the market with our intuitive solution, empowering you to make profitable decisions.
How does it work?
It employs machine learning and statistical models to pinpoint trading opportunities with precision and speed, by analyzing three measurable characteristics of price action: acceleration, mass, and sentiment.
Acceleration: It refers to the rate of change of velocity over time. It can be measured by capturing changes in the momentum or speed of price movements.
Mass: This pertains to the amount of matter in an object and is linked to its inertia and resistance to acceleration. It can be measured by identifying points where the price has gained or lost too much momentum, potentially leading to a reversal.
Sentiment: Market sentiment can be related to the fractal dimension and Hurst exponent, reflecting the presence of three types of noise: antipersistence or caution, randomness or uncertainty, and persistence or optimism. These sentiment associations provide insights into market dynamics and can assist in the decision-making process.
The KNN algorithm predicts the bullish or bearish nature of the upcoming three periods by classifying the price action into three different categories: uptrend, downtrend, or neutral, through an analysis of the three aforementioned elements.
Tips
What platform can I use it with?
We’ve developed the indicator for the Tradingview platform, using its dynamic charting functions and data processing. The indicator will provide you with open and close signals for trades, which with the Alerts option in Tradingview can be used to keep yourself updated on any trading opportunity.
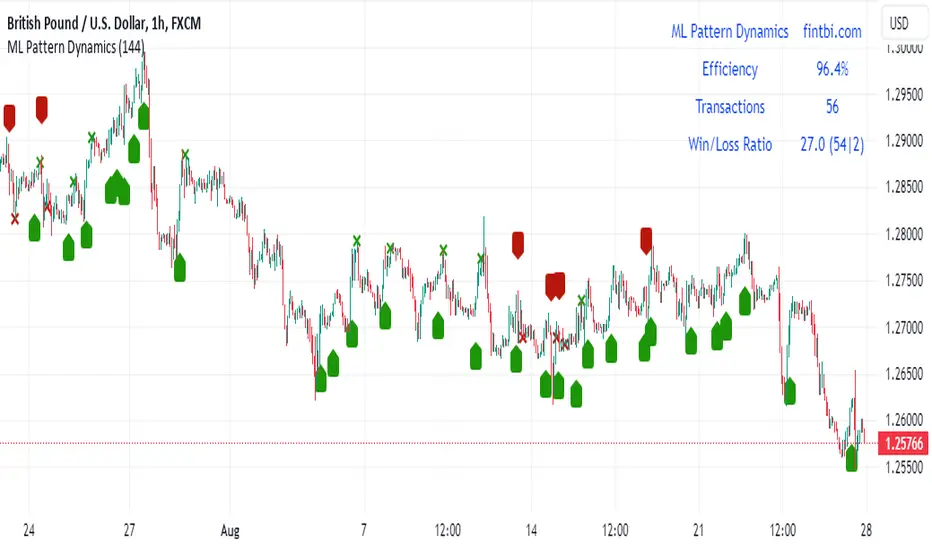
One of the main functions and advantages of the ML Pattern Dynamics indicator is its dashboard which shows the user an efficiency percentage and ratio for the signals, based on the number of periods used to analyze the market. In simple terms, the indicator lets you know according to historical analysis how precise it has been on its trading calculations and how many signals have reached their objective vs how many failed.
How can I get access to it?
Getting this innovative tool is very easy. Simply follow these steps:
**If you did not make the purchase with the same email address as your Tradingview profile, please make sure to contact us at info@oqtradetech.com with our order number and the profile that you want us to assign the indicator to.
********************************************************************************************************************************************************************************************
ML Pattern Dynamics
El indicador "ML Pattern Dynamics" para Tradingview, diseñado específicamente para traders e inversores, aprovecha la inteligencia colectiva de KNN para proporcionar predicciones precisas. Mantente un paso adelante del mercado con nuestra solución intuitiva, que te capacita para tomar decisiones rentables.
¿Cómo funciona?
Emplea aprendizaje automático (machine learning) y modelos estadísticos para identificar oportunidades de trading con precisión y rapidez, analizando tres características medibles de la acción del precio: aceleración, masa y sentimiento.
Aceleración: Se refiere a la tasa de cambio de la velocidad con el tiempo. Puede medirse capturando cambios en el impulso o velocidad de los movimientos de precio.
Masa: Se refiere a la cantidad de materia en un objeto y está relacionada con su inercia y resistencia a la aceleración. Puede medirse identificando puntos donde el precio ha ganado o perdido demasiado impulso, lo que podría llevar a un cambio de dirección.
Sentimiento: El sentimiento del mercado puede estar relacionado con la dimensión fractal y el exponente de Hurst, reflejando la presencia de tres tipos de ruido: antipersistencia o precaución, aleatoriedad o incertidumbre, y persistencia u optimismo. Estas asociaciones de sentimiento brindan información sobre la dinámica del mercado y pueden ayudar en el proceso de toma de decisiones.
El algoritmo KNN predice la naturaleza alcista o bajista de los próximos tres períodos al clasificar la acción del precio en tres categorías diferentes: tendencia al alza, tendencia a la baja o neutral, a través de un análisis de los tres elementos mencionados anteriormente.
Tips
¿En qué plataforma lo puedo utilizar?
Hemos diseñado este indicador para la plataforma Tradingview, utilizando sus dinámicas funciones de gráficos y proceso de datos. El indicador te preveera con señales de apertura y cierre de operaciones, que junto a la función de alertas de Tradingview puedes utilizar para estar al tanto de oportunidades de trading en el mercado.
Una de las funciones y ventajas principales del indicador ML Pattern Dynamics es que cuenta con un panel que provee al usuario un porcentaje y proporción de precisión de las señales, basándose en el valor de periodos utilizados para analizar el mercado. En términos simples, el indicador nos informa según su análisis histórico que tan preciso ha sido en su cálculo de trading y cuantas señales han llegado a su objetivo vs cuantas fallaron.
¿Cómo lo puedo comprar?
Obtener esta innovadora herramienta es muy fácil. Simplemente sigue estos pasos:
**Si utilizaste un correo electrónico diferente al que tienes registrado en Tradingview, asegúrate de enviarnos un mensaje a info@oqtradetech.com con tu número de orden y el correo electrónico del perfil de Tradingview al que debemos añadir el indicador.
The indicator "ML Pattern Dynamics" for Tradingview, tailored specifically for traders and investors, harnesses the collective intelligence of KNN to provide accurate predictions. Stay one step ahead of the market with our intuitive solution, empowering you to make profitable decisions.
How does it work?
It employs machine learning and statistical models to pinpoint trading opportunities with precision and speed, by analyzing three measurable characteristics of price action: acceleration, mass, and sentiment.
Acceleration: It refers to the rate of change of velocity over time. It can be measured by capturing changes in the momentum or speed of price movements.
Mass: This pertains to the amount of matter in an object and is linked to its inertia and resistance to acceleration. It can be measured by identifying points where the price has gained or lost too much momentum, potentially leading to a reversal.
Sentiment: Market sentiment can be related to the fractal dimension and Hurst exponent, reflecting the presence of three types of noise: antipersistence or caution, randomness or uncertainty, and persistence or optimism. These sentiment associations provide insights into market dynamics and can assist in the decision-making process.
The KNN algorithm predicts the bullish or bearish nature of the upcoming three periods by classifying the price action into three different categories: uptrend, downtrend, or neutral, through an analysis of the three aforementioned elements.
Tips
- Adjust: explore the impact of adjusting the sentiment cycle length within the KNN model to optimize the indicator’s performance. Fibonacci sequence is recommended (5-8-13-21-34-55-89-144…).
- Validate: The performance dashboard shows you the real-time efficiency of the indicator, among other stats by using real historical data.
- Set-up Alerts: to focus on the charts when it is truly needed.
- Combine: with other analysis, indicators, or different time frames using the same ML Pattern Dynamics to enhance your decision-making process.
- Realign: as needed to adapt the indicator signals to the latest price movements and achieve greater precision
- Stay informed and adapt: Market dynamics can change, so continuously stay updated with relevant news and adjust your trading or investing approach accordingly.
What platform can I use it with?
We’ve developed the indicator for the Tradingview platform, using its dynamic charting functions and data processing. The indicator will provide you with open and close signals for trades, which with the Alerts option in Tradingview can be used to keep yourself updated on any trading opportunity.
One of the main functions and advantages of the ML Pattern Dynamics indicator is its dashboard which shows the user an efficiency percentage and ratio for the signals, based on the number of periods used to analyze the market. In simple terms, the indicator lets you know according to historical analysis how precise it has been on its trading calculations and how many signals have reached their objective vs how many failed.
How can I get access to it?
Getting this innovative tool is very easy. Simply follow these steps:
- Purchase the indicator in our website: https://apps.oqtradetech.com/en/apps/ml-pattern-dynamics-indicator/
- Please make sure to purchase it using the same email address as the Tradingview profile where you want to use it and add your Tradingview username in the notes.**
- Within 1-2 business days our team will give you access to this private indicator in Tradingview.
**If you did not make the purchase with the same email address as your Tradingview profile, please make sure to contact us at info@oqtradetech.com with our order number and the profile that you want us to assign the indicator to.
********************************************************************************************************************************************************************************************
ML Pattern Dynamics
El indicador "ML Pattern Dynamics" para Tradingview, diseñado específicamente para traders e inversores, aprovecha la inteligencia colectiva de KNN para proporcionar predicciones precisas. Mantente un paso adelante del mercado con nuestra solución intuitiva, que te capacita para tomar decisiones rentables.
¿Cómo funciona?
Emplea aprendizaje automático (machine learning) y modelos estadísticos para identificar oportunidades de trading con precisión y rapidez, analizando tres características medibles de la acción del precio: aceleración, masa y sentimiento.
Aceleración: Se refiere a la tasa de cambio de la velocidad con el tiempo. Puede medirse capturando cambios en el impulso o velocidad de los movimientos de precio.
Masa: Se refiere a la cantidad de materia en un objeto y está relacionada con su inercia y resistencia a la aceleración. Puede medirse identificando puntos donde el precio ha ganado o perdido demasiado impulso, lo que podría llevar a un cambio de dirección.
Sentimiento: El sentimiento del mercado puede estar relacionado con la dimensión fractal y el exponente de Hurst, reflejando la presencia de tres tipos de ruido: antipersistencia o precaución, aleatoriedad o incertidumbre, y persistencia u optimismo. Estas asociaciones de sentimiento brindan información sobre la dinámica del mercado y pueden ayudar en el proceso de toma de decisiones.
El algoritmo KNN predice la naturaleza alcista o bajista de los próximos tres períodos al clasificar la acción del precio en tres categorías diferentes: tendencia al alza, tendencia a la baja o neutral, a través de un análisis de los tres elementos mencionados anteriormente.
Tips
- Ajustar: explora el impacto de ajustar la longitud del ciclo de sentimiento dentro del modelo KNN para optimizar el rendimiento del indicador. Se recomienda la secuencia de Fibonacci (5-8-13-21-34-55-89-144...).
- Validar: El panel de rendimiento te muestra la eficiencia en tiempo real del indicador, entre otras estadísticas, utilizando datos históricos reales.
- Configurar alertas: para enfocarte en los gráficos cuando realmente sea necesario.
- Combinar: con otros análisis, indicadores o marcos temporales diferentes utilizando la misma Dinámica de Patrones de Aprendizaje Automático (ML) para mejorar tu proceso de toma de decisiones.
- Reajustar: cuando sea necesario para adaptar las señales del indicador a los ultimos movimientos y conseguir mayor precision.
- Mantente informado y adapta: Las dinámicas del mercado pueden cambiar, por lo que debes mantenerte constantemente actualizado con noticias relevantes y ajustar tu enfoque de trading o inversión en consecuencia.
¿En qué plataforma lo puedo utilizar?
Hemos diseñado este indicador para la plataforma Tradingview, utilizando sus dinámicas funciones de gráficos y proceso de datos. El indicador te preveera con señales de apertura y cierre de operaciones, que junto a la función de alertas de Tradingview puedes utilizar para estar al tanto de oportunidades de trading en el mercado.
Una de las funciones y ventajas principales del indicador ML Pattern Dynamics es que cuenta con un panel que provee al usuario un porcentaje y proporción de precisión de las señales, basándose en el valor de periodos utilizados para analizar el mercado. En términos simples, el indicador nos informa según su análisis histórico que tan preciso ha sido en su cálculo de trading y cuantas señales han llegado a su objetivo vs cuantas fallaron.
¿Cómo lo puedo comprar?
Obtener esta innovadora herramienta es muy fácil. Simplemente sigue estos pasos:
- Compra el indicador en nuestra página: https://apps.oqtradetech.com/apps/ml-pattern-dynamics-indicator/
- Asegúrate de utilizar el mismo correo electrónico que utilizas en Tradingview e incluir tu nombre de usuario en las notas de la compra.**
- En 1 a 2 días hábiles, nuestro equipo procesará tu orden y el indicador será añadido a tu perfil de Tradingview.
**Si utilizaste un correo electrónico diferente al que tienes registrado en Tradingview, asegúrate de enviarnos un mensaje a info@oqtradetech.com con tu número de orden y el correo electrónico del perfil de Tradingview al que debemos añadir el indicador.
초대 전용 스크립트
이 스크립트는 작성자가 승인한 사용자만 접근할 수 있습니다. 사용하려면 요청 후 승인을 받아야 하며, 일반적으로 결제 후에 허가가 부여됩니다. 자세한 내용은 아래 작성자의 안내를 따르거나 OQTradingTechnology에게 직접 문의하세요.
이 비공개 초대 전용 스크립트는 스크립트 모더레이터의 검토를 거치지 않았으며, 하우스 룰 준수 여부는 확인되지 않았습니다. 트레이딩뷰는 스크립트의 작동 방식을 충분히 이해하고 작성자를 완전히 신뢰하지 않는 이상, 해당 스크립트에 비용을 지불하거나 사용하는 것을 권장하지 않습니다. 커뮤니티 스크립트에서 무료 오픈소스 대안을 찾아보실 수도 있습니다.
작성자 지시 사항
- Purchase the indicator in our website: https://apps.oqtradetech.com/en/apps/ml-pattern-dynamics-indicator/
면책사항
해당 정보와 게시물은 금융, 투자, 트레이딩 또는 기타 유형의 조언이나 권장 사항으로 간주되지 않으며, 트레이딩뷰에서 제공하거나 보증하는 것이 아닙니다. 자세한 내용은 이용 약관을 참조하세요.