OPEN-SOURCE SCRIPT
업데이트됨 Price Altimeter
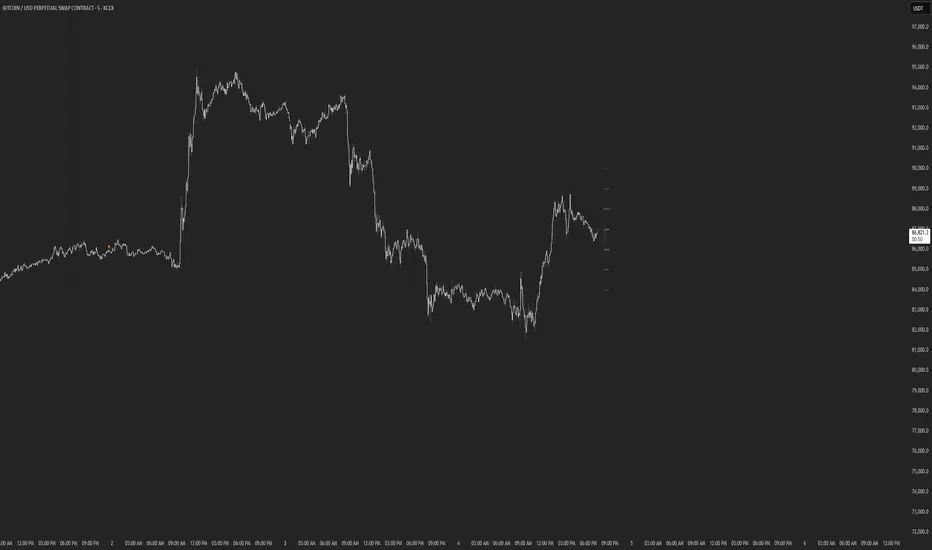
This indicator should help visualize the price, inspired by a Digital Altimeter in a Pilots HUD.
It's by default calibrated to Bitcoin, with the small levels showing every $100 and the larger levels setup to display on every $1000. But you can change this to whatever you want by changing the settings for: Small and Large Level Increments.
The default colors are grey, but can be changed to whatever you want, and there are two cause if you want they work as a gradient.
There are options to fade as the values go away from the current price action.
There are options for Forward and Backward Offsets, 0 is the current price and each value represents a candle on whatever time frame your currently on.
Other Options include the Fade Ratio, the Line Width and Style, which are all self explanatory.
Hope you Enjoy!
Backtest it in fast mode to see it in action a little better...
Known Issues:
For some reason it bug's out when either or are displaying more than 19 lines, unsure why so its limited to that for now.
Extra Note on what this may be useful for: I always wanted to make this, but didn't realize how to put things in front of the price action... Offset! Duh! Anyways, I thought of this one because I often it's hard on these charts to really get an idea for absolute price amounts across different time frames, this in an intuitive, at a glance way to see it because the regular price thing on the right always adds values between values when you zoom in and you can sometimes get lost figuring out the proportions of things.
Could also be useful for Scalping?
릴리즈 노트
v1.1Swapped the Negative on Backward Offset to a Positive and updated the defaults so both numbers are now positive and hopefully less confusing.
note: If you already had the script setup and you update, just remove the negative from your settings and it should be what you had it before.
오픈 소스 스크립트
트레이딩뷰의 진정한 정신에 따라, 이 스크립트의 작성자는 이를 오픈소스로 공개하여 트레이더들이 기능을 검토하고 검증할 수 있도록 했습니다. 작성자에게 찬사를 보냅니다! 이 코드는 무료로 사용할 수 있지만, 코드를 재게시하는 경우 하우스 룰이 적용된다는 점을 기억하세요.
면책사항
해당 정보와 게시물은 금융, 투자, 트레이딩 또는 기타 유형의 조언이나 권장 사항으로 간주되지 않으며, 트레이딩뷰에서 제공하거나 보증하는 것이 아닙니다. 자세한 내용은 이용 약관을 참조하세요.
오픈 소스 스크립트
트레이딩뷰의 진정한 정신에 따라, 이 스크립트의 작성자는 이를 오픈소스로 공개하여 트레이더들이 기능을 검토하고 검증할 수 있도록 했습니다. 작성자에게 찬사를 보냅니다! 이 코드는 무료로 사용할 수 있지만, 코드를 재게시하는 경우 하우스 룰이 적용된다는 점을 기억하세요.
면책사항
해당 정보와 게시물은 금융, 투자, 트레이딩 또는 기타 유형의 조언이나 권장 사항으로 간주되지 않으며, 트레이딩뷰에서 제공하거나 보증하는 것이 아닙니다. 자세한 내용은 이용 약관을 참조하세요.