OPEN-SOURCE SCRIPT
Frog in Pan Indicator
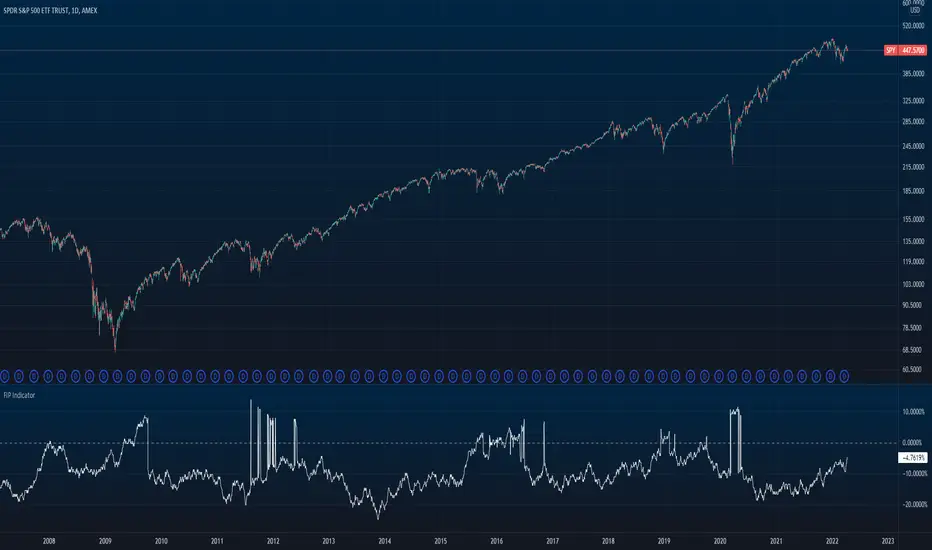
What is it?
This indicator is the percent of negative days minus the percent of positive days in a year multiplied by the sign of the overall return of the lookback (365 days for crypto and 252 days for stocks).
FIP = sign(return of lookback) * [% negative - % positive]
What is it used for?
This indicator is used as a quality screener for momentum stocks. It is based behind the ideas in Wesley Gray & Jack Vogel's book: Quantitative Momentum: A Practitioner's Guide to Building a Momentum-Based Stock Selection System that iterates that quality momentum stocks consist of steady uptrends (where more days are positive rather than negative) as opposed to characteristics of "lottery-like" stocks that are "jumpy" and more volatile. More research behind this indicator can be found here
How to use
In the indicator settings, the default lookback parameter is set to 365 days for analysis on cryptocurrencies and was used on a daily timeframe. If you want to use this indicator on individual stocks, it is best to change this lookback to 252 days. The more negative the value is, the higher quality of momentum it is.
오픈 소스 스크립트
트레이딩뷰의 진정한 정신에 따라, 이 스크립트의 작성자는 이를 오픈소스로 공개하여 트레이더들이 기능을 검토하고 검증할 수 있도록 했습니다. 작성자에게 찬사를 보냅니다! 이 코드는 무료로 사용할 수 있지만, 코드를 재게시하는 경우 하우스 룰이 적용된다는 점을 기억하세요.
면책사항
해당 정보와 게시물은 금융, 투자, 트레이딩 또는 기타 유형의 조언이나 권장 사항으로 간주되지 않으며, 트레이딩뷰에서 제공하거나 보증하는 것이 아닙니다. 자세한 내용은 이용 약관을 참조하세요.
오픈 소스 스크립트
트레이딩뷰의 진정한 정신에 따라, 이 스크립트의 작성자는 이를 오픈소스로 공개하여 트레이더들이 기능을 검토하고 검증할 수 있도록 했습니다. 작성자에게 찬사를 보냅니다! 이 코드는 무료로 사용할 수 있지만, 코드를 재게시하는 경우 하우스 룰이 적용된다는 점을 기억하세요.
면책사항
해당 정보와 게시물은 금융, 투자, 트레이딩 또는 기타 유형의 조언이나 권장 사항으로 간주되지 않으며, 트레이딩뷰에서 제공하거나 보증하는 것이 아닙니다. 자세한 내용은 이용 약관을 참조하세요.