OPEN-SOURCE SCRIPT
DS_Gurukul_5minTrend

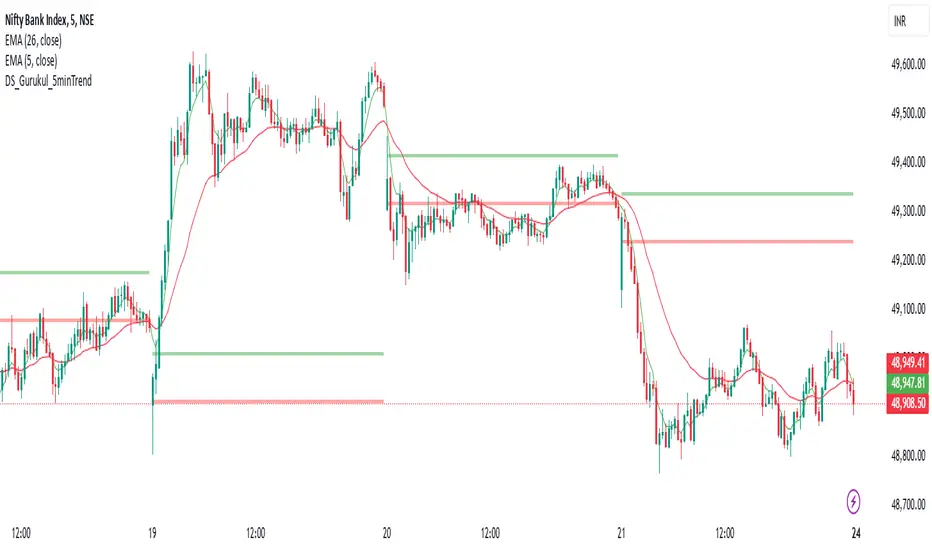
DS Gurukul (DS_5minTrend) Indicator: A Simple Yet Powerful Trend Tool
The Tushar Daily Bands (DS_5minTrend) indicator is a straightforward tool designed to help traders quickly visualize potential trend reversals and identify profitable trading opportunities. This indicator plots two bands—an upper band (green) and a lower band (red)—based on a small percentage deviation from the closing price of the first candle of each trading day.
How it Works:
The DS_5minTrend indicator calculates these bands at the start of each new trading day. The bands then remain fixed for the rest of that day. This daily reset allows traders to easily see how the current day's price action relates to the opening price and the calculated bands.
Trading Signals:
Potential Reversals: When the price approaches or touches the upper band (green), it can signal a potential overbought condition and a possible reversal to the downside. Conversely, when the price approaches or touches the lower band (red), it can suggest an oversold condition and a possible reversal to the upside.
Trend Confirmation: If the price consistently closes above the upper band for several periods, it may indicate a strong uptrend. Conversely, consistent closes below the lower band can suggest a strong downtrend.
Support and Resistance: The bands can also act as dynamic support and resistance levels. Traders can watch for price bounces off these levels as potential entry points.
How to Use:
Combine with other indicators: While DS_5minTrend can provide valuable insights, it's generally recommended to use it in conjunction with other technical indicators, such as RSI, MACD, or volume analysis, for confirmation.
Consider market context: Always consider the broader market context and news events that may be influencing price action.
Risk Management: Implement proper risk management strategies, including stop-loss orders, to protect your capital.
Disclaimer: The DS_5minTrend indicator is a tool for analysis and should not be the sole basis for making trading decisions. Trading involves substantial risk, and you could lose money. Always do your own research and consult with a financial advisor before making any investment decisions.
오픈 소스 스크립트
트레이딩뷰의 진정한 정신에 따라, 이 스크립트의 작성자는 이를 오픈소스로 공개하여 트레이더들이 기능을 검토하고 검증할 수 있도록 했습니다. 작성자에게 찬사를 보냅니다! 이 코드는 무료로 사용할 수 있지만, 코드를 재게시하는 경우 하우스 룰이 적용된다는 점을 기억하세요.
면책사항
해당 정보와 게시물은 금융, 투자, 트레이딩 또는 기타 유형의 조언이나 권장 사항으로 간주되지 않으며, 트레이딩뷰에서 제공하거나 보증하는 것이 아닙니다. 자세한 내용은 이용 약관을 참조하세요.
오픈 소스 스크립트
트레이딩뷰의 진정한 정신에 따라, 이 스크립트의 작성자는 이를 오픈소스로 공개하여 트레이더들이 기능을 검토하고 검증할 수 있도록 했습니다. 작성자에게 찬사를 보냅니다! 이 코드는 무료로 사용할 수 있지만, 코드를 재게시하는 경우 하우스 룰이 적용된다는 점을 기억하세요.
면책사항
해당 정보와 게시물은 금융, 투자, 트레이딩 또는 기타 유형의 조언이나 권장 사항으로 간주되지 않으며, 트레이딩뷰에서 제공하거나 보증하는 것이 아닙니다. 자세한 내용은 이용 약관을 참조하세요.