OPEN-SOURCE SCRIPT
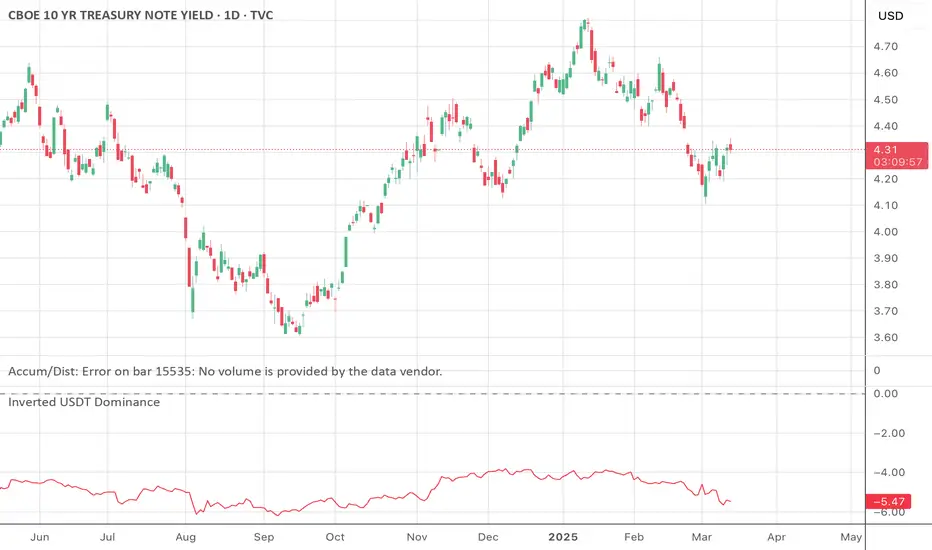
Inverted USDT Dominance

Inverted USDT Dominance Indicator
This simple yet powerful indicator plots the inverted USDT Dominance (USDT.D), making it visually intuitive to analyze market sentiment shifts. Typically, USDT dominance rises when investors seek stability, indicating a "risk-off" market environment. Conversely, it falls when investors pursue riskier assets like cryptocurrencies, signaling a "risk-on" environment.
Why invert the USDT Dominance chart?
By flipping USDT Dominance around the zero line, this indicator allows traders and investors to more clearly visualize its correlation and divergence with traditional market indicators like the 10-year Treasury yield (TNX), Bitcoin, or equity indices. A rising line on this inverted indicator intuitively indicates increasing market risk appetite, whereas a falling line highlights growing risk aversion.
Use cases:
Quickly visualize market sentiment (risk-on vs. risk-off).
Identify divergences and correlations between crypto markets and traditional financial instruments.
Enhance portfolio allocation decisions by clearly seeing sentiment changes.
오픈 소스 스크립트
트레이딩뷰의 진정한 정신에 따라, 이 스크립트의 작성자는 이를 오픈소스로 공개하여 트레이더들이 기능을 검토하고 검증할 수 있도록 했습니다. 작성자에게 찬사를 보냅니다! 이 코드는 무료로 사용할 수 있지만, 코드를 재게시하는 경우 하우스 룰이 적용된다는 점을 기억하세요.
면책사항
해당 정보와 게시물은 금융, 투자, 트레이딩 또는 기타 유형의 조언이나 권장 사항으로 간주되지 않으며, 트레이딩뷰에서 제공하거나 보증하는 것이 아닙니다. 자세한 내용은 이용 약관을 참조하세요.
오픈 소스 스크립트
트레이딩뷰의 진정한 정신에 따라, 이 스크립트의 작성자는 이를 오픈소스로 공개하여 트레이더들이 기능을 검토하고 검증할 수 있도록 했습니다. 작성자에게 찬사를 보냅니다! 이 코드는 무료로 사용할 수 있지만, 코드를 재게시하는 경우 하우스 룰이 적용된다는 점을 기억하세요.
면책사항
해당 정보와 게시물은 금융, 투자, 트레이딩 또는 기타 유형의 조언이나 권장 사항으로 간주되지 않으며, 트레이딩뷰에서 제공하거나 보증하는 것이 아닙니다. 자세한 내용은 이용 약관을 참조하세요.