OPEN-SOURCE SCRIPT
업데이트됨 Smooth Fibonacci Bands
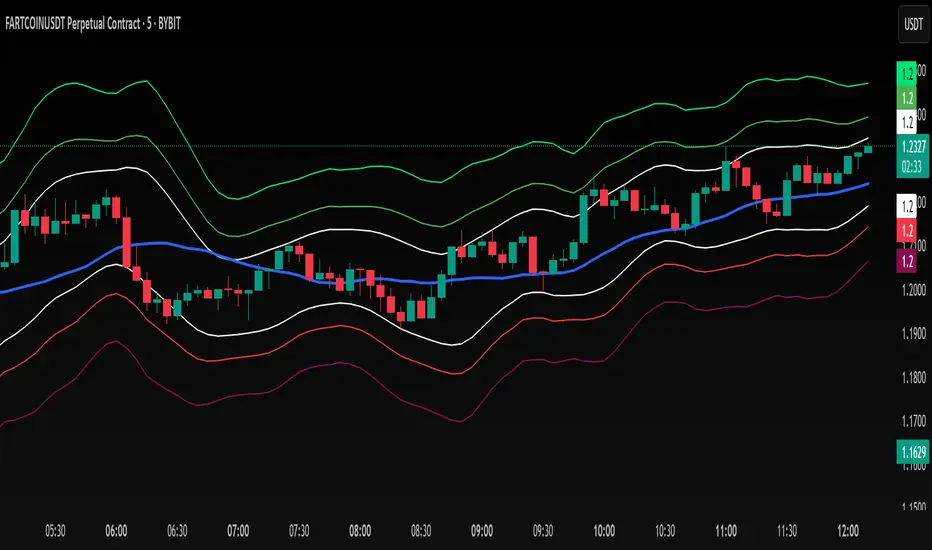
Smooth Fibonacci Bands
This indicator overlays adaptive Fibonacci bands on your chart, creating dynamic support and resistance zones based on price volatility. It combines a simple moving average with ATR-based Fibonacci levels to generate multiple bands that expand and contract with market conditions.
## Features
- Creates three pairs of upper and lower Fibonacci bands
- Smoothing option for cleaner, less noisy bands
- Fully customizable colors and line thickness
- Adapts automatically to changing market volatility
## Settings
Adjust the SMA and ATR lengths to match your trading timeframe. For short-term trading, try lower values; for longer-term analysis, use higher values. The Fibonacci factors determine how far each band extends from the center line - standard Fibonacci ratios (1.618, 2.618, and 4.236) are provided as defaults.
## Trading Applications
- Use band crossovers as potential entry and exit signals
- Look for price bouncing off bands as reversal opportunities
- Watch for price breaking through multiple bands as strong trend confirmation
- Identify potential support/resistance zones for placing stop losses or take profits
Fibonacci Bands combines the reliability of moving averages with the adaptability of ATR and the natural market harmony of Fibonacci ratios, offering a robust framework for both trend and range analysis.
릴리즈 노트
Added Alerts FunctionalityThe indicator provides alerts for price crossovers of each band:
Middle line (SMA) crossovers
Upper and lower band crossings for all three Fibonacci levels
Customizable alert settings to focus only on bands you're trading
Trading Applications
Use band crossovers as potential entry and exit signals (with automatic alerts)
Look for price bouncing off bands as reversal opportunities
Watch for price breaking through multiple bands as strong trend confirmation
Identify potential support/resistance zones for placing stop losses or take profits
릴리즈 노트
Changed the default Lengths from 50, 14, and 5 to 8,6 and 3 for optimizing the 5 min time frame오픈 소스 스크립트
트레이딩뷰의 진정한 정신에 따라, 이 스크립트의 작성자는 이를 오픈소스로 공개하여 트레이더들이 기능을 검토하고 검증할 수 있도록 했습니다. 작성자에게 찬사를 보냅니다! 이 코드는 무료로 사용할 수 있지만, 코드를 재게시하는 경우 하우스 룰이 적용된다는 점을 기억하세요.
면책사항
해당 정보와 게시물은 금융, 투자, 트레이딩 또는 기타 유형의 조언이나 권장 사항으로 간주되지 않으며, 트레이딩뷰에서 제공하거나 보증하는 것이 아닙니다. 자세한 내용은 이용 약관을 참조하세요.
오픈 소스 스크립트
트레이딩뷰의 진정한 정신에 따라, 이 스크립트의 작성자는 이를 오픈소스로 공개하여 트레이더들이 기능을 검토하고 검증할 수 있도록 했습니다. 작성자에게 찬사를 보냅니다! 이 코드는 무료로 사용할 수 있지만, 코드를 재게시하는 경우 하우스 룰이 적용된다는 점을 기억하세요.
면책사항
해당 정보와 게시물은 금융, 투자, 트레이딩 또는 기타 유형의 조언이나 권장 사항으로 간주되지 않으며, 트레이딩뷰에서 제공하거나 보증하는 것이 아닙니다. 자세한 내용은 이용 약관을 참조하세요.