INVITE-ONLY SCRIPT
Trend Optimizer
What is this?
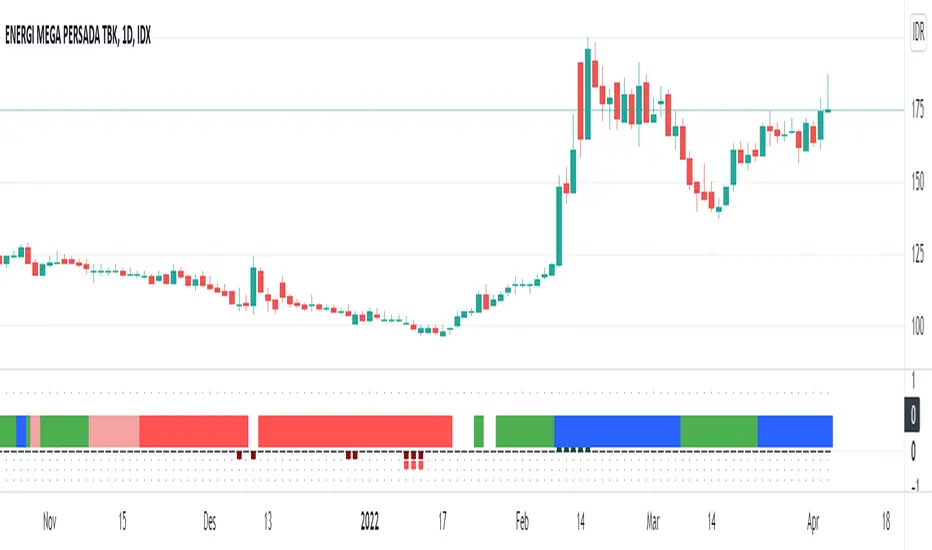
This horizontal trend color and vertical trend bar is a trend identification to optimize your positioning in the market. Colors helps you to understand the trend easily, spontaneously.
The indicators & Strategies?
1. A horizontal trend color which represents the medium term trend. The color change is based on the price position towards moving average. We exclude the moving averaged from chart area so the chart area will be clean and you'll have an easier interpretation. This trend color helps you to understand the major trend as simple as you see navigation maps in your smartphone. When the trend color changed from the long red into white, then green, then blue, it indicates a bottom reversal. This module will work best with out other module: Trend Optimizer Module and Momentum line Module.
2. A vertical trend bar represents long term trend. Bars that above the axis is an uptrend bar. If it occurs, the long term bullish trend is exists. Bars below the axis is a downtrend bar. If it occurs, the long term bearish trend is exists. If there is no bars (empty), means the long term trend is weakened but the trend still as same as the last bars occurrence.
Benefit for you:
You'll have a guidance the existing trend and the trend progress from time to time.
If you combine this script with our other two module: Profit Trader module & Momentum Line Module, You'll have a complete template to analyze both trend and swing strategies.
초대 전용 스크립트
이 스크립트는 작성자가 승인한 사용자만 접근할 수 있습니다. 사용하려면 요청 후 승인을 받아야 하며, 일반적으로 결제 후에 허가가 부여됩니다. 자세한 내용은 아래 작성자의 안내를 따르거나 galerisaham에게 직접 문의하세요.
트레이딩뷰는 스크립트의 작동 방식을 충분히 이해하고 작성자를 완전히 신뢰하지 않는 이상, 해당 스크립트에 비용을 지불하거나 사용하는 것을 권장하지 않습니다. 커뮤니티 스크립트에서 무료 오픈소스 대안을 찾아보실 수도 있습니다.
작성자 지시 사항
To use this scipt, visit https://galerisaham.com/modul for further information.
We Build Profitable Traders | Visit: galerisaham.com/pro/
면책사항
해당 정보와 게시물은 금융, 투자, 트레이딩 또는 기타 유형의 조언이나 권장 사항으로 간주되지 않으며, 트레이딩뷰에서 제공하거나 보증하는 것이 아닙니다. 자세한 내용은 이용 약관을 참조하세요.