PROTECTED SOURCE SCRIPT
Range Plot
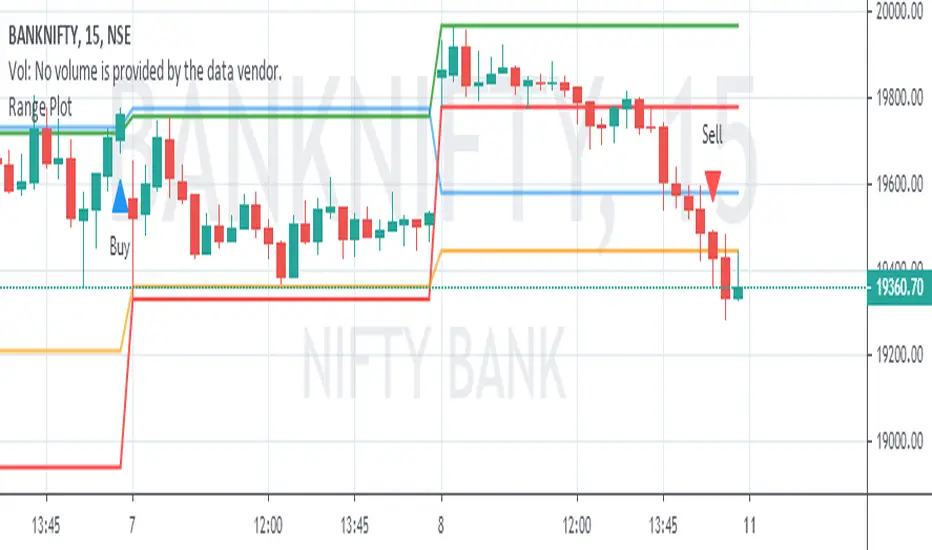
Today's first 75 minutes candle high in darker blue color and today's first 75 minutes candle low in darker red color.
Previous trading session last 75 minutes candle high in green color and previous trading session last 75 minutes candle low in orange color.
Today's marking are in blue n red little darker and previous day's last candle marking are in orange and red.
You are likely to familiar with the opening range of 5 min, 15 min, or even of 60 min also. In the opening range, we use today's' candle only. In the range plot, we have made a little addition of previous trading session last candle also. And we got very good results.
Price doesn't know what we have plotted. we just try to make our trading decisions around this area.
Range plot give very good signal in trending scripts and it helps to keep us out from ranging stock.
보호된 스크립트입니다
이 스크립트는 비공개 소스로 게시됩니다. 하지만 이를 자유롭게 제한 없이 사용할 수 있습니다 – 자세한 내용은 여기에서 확인하세요.
면책사항
해당 정보와 게시물은 금융, 투자, 트레이딩 또는 기타 유형의 조언이나 권장 사항으로 간주되지 않으며, 트레이딩뷰에서 제공하거나 보증하는 것이 아닙니다. 자세한 내용은 이용 약관을 참조하세요.
보호된 스크립트입니다
이 스크립트는 비공개 소스로 게시됩니다. 하지만 이를 자유롭게 제한 없이 사용할 수 있습니다 – 자세한 내용은 여기에서 확인하세요.
면책사항
해당 정보와 게시물은 금융, 투자, 트레이딩 또는 기타 유형의 조언이나 권장 사항으로 간주되지 않으며, 트레이딩뷰에서 제공하거나 보증하는 것이 아닙니다. 자세한 내용은 이용 약관을 참조하세요.