OPEN-SOURCE SCRIPT
Support and Resistance Levels
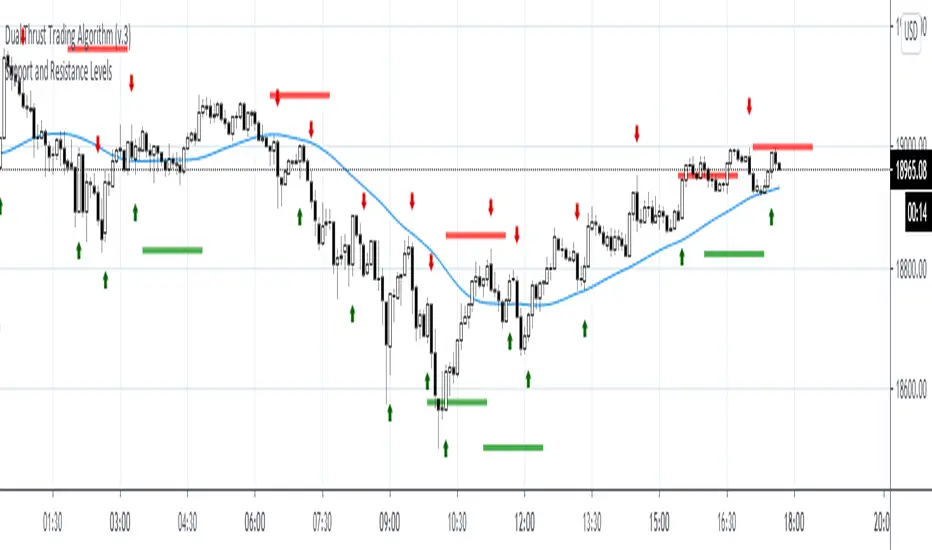
Detecting Support and Resistance Levels
Description:
Support & Resistance levels are essential for every trader to define the decision points of the markets. If you are long and the market falls below the previous support level, you most probably have got the wrong position and better exit.
This script uses the first and second deviation of a curve to find the turning points and extremes of the price curve.
The deviation of a curve is nothing else than the momentum of a curve (and inertia is another name for momentum). It defines the slope of the curve. If the slope of a curve is zero, you have found a local extreme. The curve will change from rising to falling or the other way round.
The second deviation, or the momentum of momentum, shows you the turning points of the first deviation. This is important, as at this point the original curve will switch from acceleration to break mode.
Using the logic laid out above the support&resistance indicator will show the turning points of the market in a timely manner. Depending on level of market-smoothing it will show the long term or short term turning points.
This script first calculates the first and second deviation of the smoothed market, and in a second step runs the turning point detection.
Style tags: Trend Following, Trend Analysis
Asset class: Equities, Futures, ETFs, Currencies and Commodities
Dataset: FX Minutes/Hours/Days
오픈 소스 스크립트
트레이딩뷰의 진정한 정신에 따라, 이 스크립트의 작성자는 이를 오픈소스로 공개하여 트레이더들이 기능을 검토하고 검증할 수 있도록 했습니다. 작성자에게 찬사를 보냅니다! 이 코드는 무료로 사용할 수 있지만, 코드를 재게시하는 경우 하우스 룰이 적용된다는 점을 기억하세요.
면책사항
해당 정보와 게시물은 금융, 투자, 트레이딩 또는 기타 유형의 조언이나 권장 사항으로 간주되지 않으며, 트레이딩뷰에서 제공하거나 보증하는 것이 아닙니다. 자세한 내용은 이용 약관을 참조하세요.
오픈 소스 스크립트
트레이딩뷰의 진정한 정신에 따라, 이 스크립트의 작성자는 이를 오픈소스로 공개하여 트레이더들이 기능을 검토하고 검증할 수 있도록 했습니다. 작성자에게 찬사를 보냅니다! 이 코드는 무료로 사용할 수 있지만, 코드를 재게시하는 경우 하우스 룰이 적용된다는 점을 기억하세요.
면책사항
해당 정보와 게시물은 금융, 투자, 트레이딩 또는 기타 유형의 조언이나 권장 사항으로 간주되지 않으며, 트레이딩뷰에서 제공하거나 보증하는 것이 아닙니다. 자세한 내용은 이용 약관을 참조하세요.