OPEN-SOURCE SCRIPT
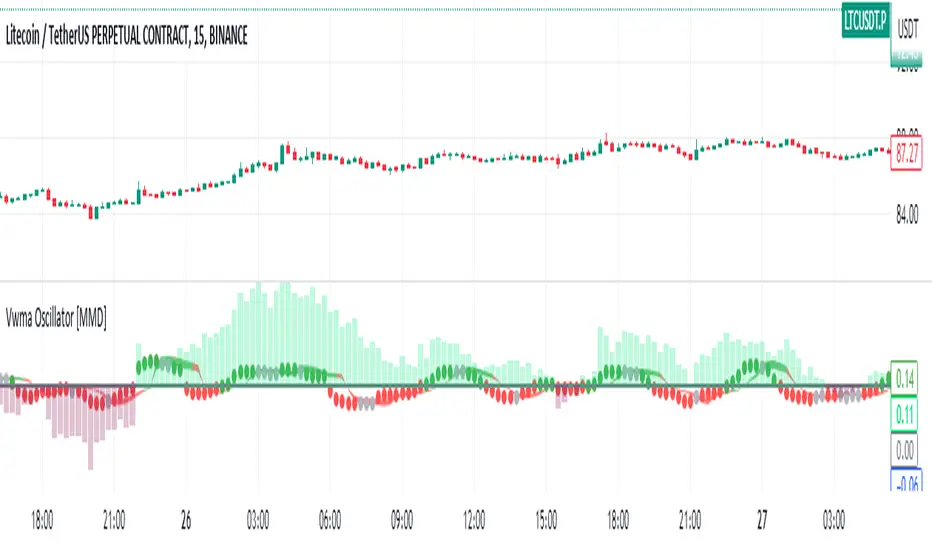
업데이트됨 Vwma Oscillator [MMD]
This line calculates the exponential moving average (EMA) of the product of the close price and volume, divided by the EMA of the volume. The EMA is calculated over a period of 4 bars.
This line calculates the difference between the value of a1 and the volume-weighted moving average (VWMA) of the close price. The VWMA is calculated over a period of 8 bars.
This line calculates a3 as twice the VWMA of a2 over a period of 8 bars, minus the VWMA of a2 over a period of 16 bars.
This line plots the value of a3 on the chart. The color of the plot is determined by the condition inside the color argument. If a3 is within 20% of its previous value (a3[3]) in either direction, the color is set to silver. Otherwise, if a3 is greater than 0, the color is set to green; otherwise, it is set to red. The linewidth parameter sets the thickness of the plot, and the style parameter specifies that circles should be used to plot the values.
These lines plot two horizontal lines on the chart, one at 80% of the previous a3 value (a3[3]*0.8) and the other at 120% of the previous a3 value (a3[3]*1.2). The transp=100 parameter makes the lines transparent. The fill function is then used to fill the area between these lines with either a red or green color, depending on whether a3 at the current bar is greater or smaller than the corresponding values.
This line plots a horizontal line at a value of 0 on the chart. The color is set to gray, and the line width is set to 2.
Overall, this indicator calculates the values of a1, a2, and a3 based on moving averages and
릴리즈 노트
Added Sar Ema Columns오픈 소스 스크립트
트레이딩뷰의 진정한 정신에 따라, 이 스크립트의 작성자는 이를 오픈소스로 공개하여 트레이더들이 기능을 검토하고 검증할 수 있도록 했습니다. 작성자에게 찬사를 보냅니다! 이 코드는 무료로 사용할 수 있지만, 코드를 재게시하는 경우 하우스 룰이 적용된다는 점을 기억하세요.
면책사항
해당 정보와 게시물은 금융, 투자, 트레이딩 또는 기타 유형의 조언이나 권장 사항으로 간주되지 않으며, 트레이딩뷰에서 제공하거나 보증하는 것이 아닙니다. 자세한 내용은 이용 약관을 참조하세요.
오픈 소스 스크립트
트레이딩뷰의 진정한 정신에 따라, 이 스크립트의 작성자는 이를 오픈소스로 공개하여 트레이더들이 기능을 검토하고 검증할 수 있도록 했습니다. 작성자에게 찬사를 보냅니다! 이 코드는 무료로 사용할 수 있지만, 코드를 재게시하는 경우 하우스 룰이 적용된다는 점을 기억하세요.
면책사항
해당 정보와 게시물은 금융, 투자, 트레이딩 또는 기타 유형의 조언이나 권장 사항으로 간주되지 않으며, 트레이딩뷰에서 제공하거나 보증하는 것이 아닙니다. 자세한 내용은 이용 약관을 참조하세요.