PROTECTED SOURCE SCRIPT
업데이트됨 CAGR Indicator (Flexible Holding Period)
CAGR Indicator (Flexible Holding Period)
The CAGR Indicator (Flexible Holding Period) is designed to convert any cumulative investment outcome into a standardized, annualized growth rate that can be compared across assets, strategies, and time horizons. Its core metric is the compound annual growth rate, which represents the constant yearly rate that, if compounded smoothly, transforms an initial value into a final value over a specified horizon. By annualizing returns, the indicator removes distortions caused by unequal test lengths and allows direct comparison with benchmarks such as index returns or risk-free rates.
Conceptually, the indicator proceeds in two stages: measuring growth and normalizing time. Growth is summarized by the growth multiple, which is the ratio of ending value to starting value when concrete values are provided, or equivalently 1 plus total percentage return divided by 100 when only a cumulative percent is known. Time is normalized by converting the user’s holding period into a year-equivalent, so that a 45-day, 30-week, 18-month, or multi-year interval can all be mapped onto a common annual scale. The conversions use widely accepted approximations: days divided by 365.25, weeks divided by approximately 52.1429, and months divided by 12, while years are used as entered.
Once growth and time are expressed in compatible units, the indicator applies the standard compounding identity: CAGR = (Growth Multiple)^(1/T) − 1, where T is the year-equivalent holding period. This transformation inverts the compounding process and yields the geometric mean rate of return per year. Because the geometric mean is path-independent, the CAGR summarizes start-to-finish performance without reference to the sequence of gains and losses. The output therefore reflects the constant annual rate that would have produced the observed terminal value from the initial value if returns had been smooth.
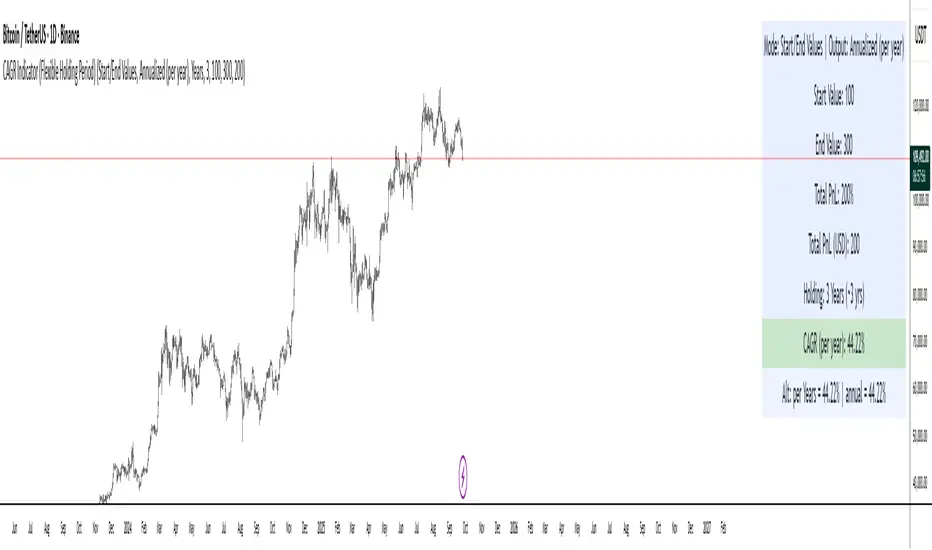
The indicator admits two data entry modes to accommodate common reporting practices. In Start/End Values mode, the user supplies initial and final portfolio values; the indicator computes the growth multiple as end divided by start and also displays absolute profit or loss in currency terms to aid practical interpretation. In Total PnL (%) mode, the user supplies a cumulative return percentage; the indicator converts this to a growth multiple and estimates a corresponding ending value for display, while the CAGR computation itself relies only on the multiple and the time horizon.
Validity checks ensure that reported numbers are meaningful. The growth multiple must be strictly positive; cumulative losses at or below minus one hundred percent make the multiple nonpositive and render the CAGR undefined. The holding period must be positive and convertible to a year-equivalent. In Start/End mode, the starting value must exceed zero to avoid division by zero and degenerate ratios. When these conditions are not met, the indicator withholds a numeric result and signals that the quantity is not well defined.
Interpreting the output requires recognizing both its strengths and its limits. The CAGR is a concise, comparable measure of long-run performance that abstracts from timing and volatility. It is particularly useful for benchmarking strategies of different durations, setting policy targets for funds, communicating results to stakeholders, and aligning outcomes with hurdle rates. However, because it is path-independent, the CAGR does not reflect interim drawdowns, variance, or tail risk. It also presumes a lump-sum investment with no intermediate cash flows; when deposits or withdrawals occur, internal rate of return methods such as IRR or XIRR are more appropriate.
Typical applications include comparing backtests with unequal sample lengths, reporting consolidated results from discrete projects on a common annual basis, and translating short-horizon event outcomes (for example, a multi-week campaign) into an annualized figure for decision-making. The indicator’s auxiliary displays, such as total profit or loss in currency and the explicit statement of the original holding period alongside its year-equivalent, improve transparency and auditability of the transformation.
Users should remain mindful of several caveats. Time conversions rely on conventional averages and may differ from calendar-exact counts by small amounts, which is usually immaterial but worth noting for edge cases. Selection bias can inflate reported CAGRs if intervals are cherry-picked; robust practice involves rolling windows, out-of-sample tests, and sensitivity analysis. Most importantly, the CAGR should be paired with risk and stability measures—such as maximum drawdown, Sharpe or Sortino ratios, downside deviation, or ulcer index—to form a complete assessment of a strategy’s quality.
In sum, the indicator operationalizes a simple but powerful idea: separate the measurement of growth from the normalization of time, then apply the compounding identity to express outcomes as a consistent per-year rate. By combining flexible period inputs with a rigorous geometric transformation, it enables fair, intelligible comparisons while encouraging the complementary use of risk diagnostics to avoid over-reliance on a single summary statistic.
The CAGR Indicator (Flexible Holding Period) is designed to convert any cumulative investment outcome into a standardized, annualized growth rate that can be compared across assets, strategies, and time horizons. Its core metric is the compound annual growth rate, which represents the constant yearly rate that, if compounded smoothly, transforms an initial value into a final value over a specified horizon. By annualizing returns, the indicator removes distortions caused by unequal test lengths and allows direct comparison with benchmarks such as index returns or risk-free rates.
Conceptually, the indicator proceeds in two stages: measuring growth and normalizing time. Growth is summarized by the growth multiple, which is the ratio of ending value to starting value when concrete values are provided, or equivalently 1 plus total percentage return divided by 100 when only a cumulative percent is known. Time is normalized by converting the user’s holding period into a year-equivalent, so that a 45-day, 30-week, 18-month, or multi-year interval can all be mapped onto a common annual scale. The conversions use widely accepted approximations: days divided by 365.25, weeks divided by approximately 52.1429, and months divided by 12, while years are used as entered.
Once growth and time are expressed in compatible units, the indicator applies the standard compounding identity: CAGR = (Growth Multiple)^(1/T) − 1, where T is the year-equivalent holding period. This transformation inverts the compounding process and yields the geometric mean rate of return per year. Because the geometric mean is path-independent, the CAGR summarizes start-to-finish performance without reference to the sequence of gains and losses. The output therefore reflects the constant annual rate that would have produced the observed terminal value from the initial value if returns had been smooth.
The indicator admits two data entry modes to accommodate common reporting practices. In Start/End Values mode, the user supplies initial and final portfolio values; the indicator computes the growth multiple as end divided by start and also displays absolute profit or loss in currency terms to aid practical interpretation. In Total PnL (%) mode, the user supplies a cumulative return percentage; the indicator converts this to a growth multiple and estimates a corresponding ending value for display, while the CAGR computation itself relies only on the multiple and the time horizon.
Validity checks ensure that reported numbers are meaningful. The growth multiple must be strictly positive; cumulative losses at or below minus one hundred percent make the multiple nonpositive and render the CAGR undefined. The holding period must be positive and convertible to a year-equivalent. In Start/End mode, the starting value must exceed zero to avoid division by zero and degenerate ratios. When these conditions are not met, the indicator withholds a numeric result and signals that the quantity is not well defined.
Interpreting the output requires recognizing both its strengths and its limits. The CAGR is a concise, comparable measure of long-run performance that abstracts from timing and volatility. It is particularly useful for benchmarking strategies of different durations, setting policy targets for funds, communicating results to stakeholders, and aligning outcomes with hurdle rates. However, because it is path-independent, the CAGR does not reflect interim drawdowns, variance, or tail risk. It also presumes a lump-sum investment with no intermediate cash flows; when deposits or withdrawals occur, internal rate of return methods such as IRR or XIRR are more appropriate.
Typical applications include comparing backtests with unequal sample lengths, reporting consolidated results from discrete projects on a common annual basis, and translating short-horizon event outcomes (for example, a multi-week campaign) into an annualized figure for decision-making. The indicator’s auxiliary displays, such as total profit or loss in currency and the explicit statement of the original holding period alongside its year-equivalent, improve transparency and auditability of the transformation.
Users should remain mindful of several caveats. Time conversions rely on conventional averages and may differ from calendar-exact counts by small amounts, which is usually immaterial but worth noting for edge cases. Selection bias can inflate reported CAGRs if intervals are cherry-picked; robust practice involves rolling windows, out-of-sample tests, and sensitivity analysis. Most importantly, the CAGR should be paired with risk and stability measures—such as maximum drawdown, Sharpe or Sortino ratios, downside deviation, or ulcer index—to form a complete assessment of a strategy’s quality.
In sum, the indicator operationalizes a simple but powerful idea: separate the measurement of growth from the normalization of time, then apply the compounding identity to express outcomes as a consistent per-year rate. By combining flexible period inputs with a rigorous geometric transformation, it enables fair, intelligible comparisons while encouraging the complementary use of risk diagnostics to avoid over-reliance on a single summary statistic.
릴리즈 노트
The new version of the CAGR Indicator (Flexible Holding Period) introduces several meaningful enhancements compared to the older version. While the core functionality of measuring growth through the CAGR formula remains unchanged, the update extends both flexibility and interpretability for users.First, the new code allows the user to choose how the output rate is displayed. In the earlier version, the indicator always reported CAGR in annualized terms, meaning the return was converted into a per-year growth rate regardless of the holding period unit. In the new version, a new input option called Output Rate As has been added, offering two choices: Annualized (per year) or Per Selected Unit. This enables users not only to see returns in the standard per-year format but also in the unit of their choice, whether per day, per week, per month, or per year. This additional flexibility is especially valuable for traders and strategies with shorter horizons, where interpreting returns on the same scale as the trading frequency is more intuitive.
Second, the new version calculates and stores both the per-unit rate and the annualized rate. The logic separates the two: the per-unit rate is derived directly from the specified number of periods (e.g., 18 months or 45 days), while the annualized rate continues to use the converted year-equivalent measure. This dual calculation ensures that the indicator can switch smoothly between output modes and, at the same time, provide alternative reference values. To highlight this improvement, the table now includes an additional line (Alt:) showing both the per-unit return and the annualized return together. This makes it easy for users to compare the two views side by side without changing settings.
Third, the new table design has been expanded from seven to eight rows. The extra row provides space for displaying the alternative results, ensuring clarity and avoiding the need to overwrite or remove existing information. Alongside this, the label text has been refined to reflect the chosen output mode more clearly, distinguishing between “CAGR (per year)” and “Return per [unit]” depending on the setting.
In summary, the new version does not alter the mathematical essence of CAGR but enhances the indicator with greater flexibility in reporting results, dual calculation modes (per-unit and annualized), and a more informative display table. These improvements make the tool more versatile, user-friendly, and suitable for both long-term investors and short-term traders who may want to assess performance in different time frames.
릴리즈 노트
The new Pine Script code is identical to the original in functionality, logic, and output, with no changes to calculations, variables, or structure. The only difference is the addition of detailed inline comments in English, explaining each line’s purpose and functionality. These comments enhance readability and understanding for users, especially beginners or developers, without affecting the indicator’s behavior, inputs, or displayed table.보호된 스크립트입니다
이 스크립트는 비공개 소스로 게시됩니다. 하지만 이를 자유롭게 제한 없이 사용할 수 있습니다 – 자세한 내용은 여기에서 확인하세요.
면책사항
해당 정보와 게시물은 금융, 투자, 트레이딩 또는 기타 유형의 조언이나 권장 사항으로 간주되지 않으며, 트레이딩뷰에서 제공하거나 보증하는 것이 아닙니다. 자세한 내용은 이용 약관을 참조하세요.
면책사항
해당 정보와 게시물은 금융, 투자, 트레이딩 또는 기타 유형의 조언이나 권장 사항으로 간주되지 않으며, 트레이딩뷰에서 제공하거나 보증하는 것이 아닙니다. 자세한 내용은 이용 약관을 참조하세요.