OPEN-SOURCE SCRIPT
업데이트됨 Bollinger Band PW Package
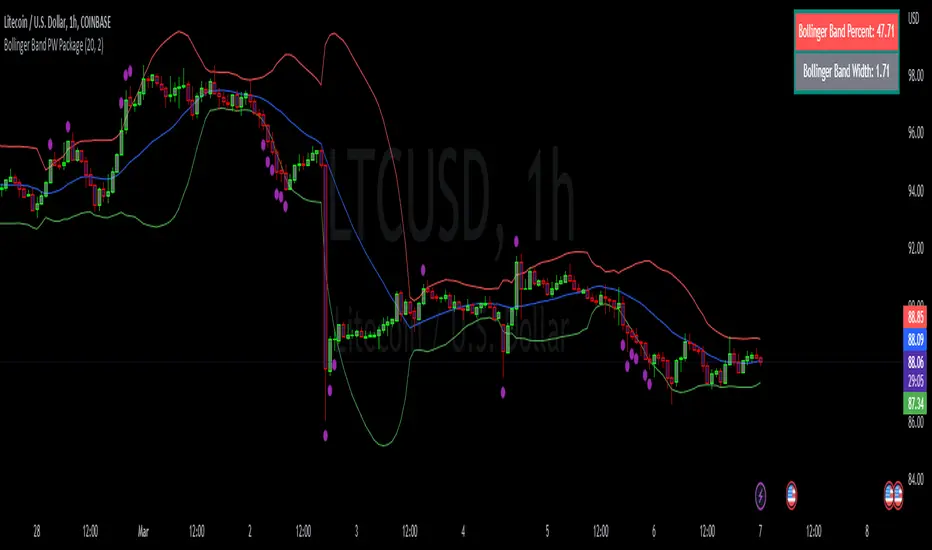
This script creates a Bollinger Band Package with Bollinger Band Percent and Width displayed on chart. The indicator also prints signals when price closes above or below the Bollinger Bands using shapes (circles by default). Bollinger Bands were created by John Bollinger, and consist of three lines plotted on a chart: the basis line (typically a moving average, 20 sma by default), an upper line (equal to the basis plus a certain number of standard deviations of the price, 2), and a lower line (equal to the basis minus the same number of standard deviations, 2 by default).
The script calculates the Bollinger Bands for a given input parameters by taking the length of the moving average and the number of standard deviations to use for the upper and lower bands. It then calculates the Bollinger Bands using these input parameters.
The script defines two functions: get_bb_percent() and get_bb_width(). The get_bb_percent() function calculates the percentage distance between the closing price and the lower band, as a percentage of the total distance between the upper and lower bands. This value is commonly referred to as the "Bollinger Band Percent". The get_bb_width() function calculates the percentage distance between the upper and lower bands, as a percentage of the basis line. This value is commonly referred to as the "Bollinger Band Width".
The script creates a table at the middle right of the chart, where the Bollinger Band Percent and Width values are displayed. The table is designed with two rows, one for the Bollinger Band Percent value and the other for the Bollinger Band Width value.
The script plots the three Bollinger Bands lines on the chart. The basis line is plotted in blue, the upper band line in red, and the lower band line in green.
The script then plots the shapes that signify closures above and below the bands using plotshape. The shapes and colors are customizable in the settings menu.
This indicator is designed to have all three components and a visual aid to assist Bollinger Band technical analysis in one script which can be helpful in determining potential trading opportunities. We thank John Bollinger for his contribution to technical analysis and trading.
Please give feedback and modify to your liking.
릴리즈 노트
-Updated the table showing the BB% and BB Width with a frame, border, and background colors to make the table visible on charts with light backgrounds-Updated the BB% table cell background to display green when % is above 50% and red when below 50%
릴리즈 노트
-Updated table position to the top right per user request오픈 소스 스크립트
트레이딩뷰의 진정한 정신에 따라, 이 스크립트의 작성자는 이를 오픈소스로 공개하여 트레이더들이 기능을 검토하고 검증할 수 있도록 했습니다. 작성자에게 찬사를 보냅니다! 이 코드는 무료로 사용할 수 있지만, 코드를 재게시하는 경우 하우스 룰이 적용된다는 점을 기억하세요.
면책사항
해당 정보와 게시물은 금융, 투자, 트레이딩 또는 기타 유형의 조언이나 권장 사항으로 간주되지 않으며, 트레이딩뷰에서 제공하거나 보증하는 것이 아닙니다. 자세한 내용은 이용 약관을 참조하세요.
오픈 소스 스크립트
트레이딩뷰의 진정한 정신에 따라, 이 스크립트의 작성자는 이를 오픈소스로 공개하여 트레이더들이 기능을 검토하고 검증할 수 있도록 했습니다. 작성자에게 찬사를 보냅니다! 이 코드는 무료로 사용할 수 있지만, 코드를 재게시하는 경우 하우스 룰이 적용된다는 점을 기억하세요.
면책사항
해당 정보와 게시물은 금융, 투자, 트레이딩 또는 기타 유형의 조언이나 권장 사항으로 간주되지 않으며, 트레이딩뷰에서 제공하거나 보증하는 것이 아닙니다. 자세한 내용은 이용 약관을 참조하세요.