INVITE-ONLY SCRIPT
BORCv5: Breakout Reversal, Standard Deviation & Bollinger Bands
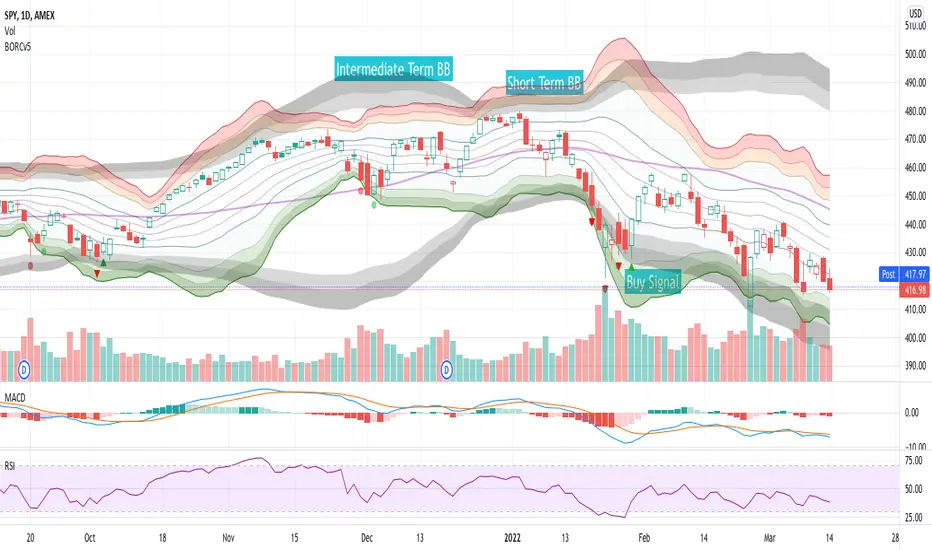
The BORCv5 (Breakout Reversal Confirmation) script can improve your trading by visualizing the standard deviation lines & bollinger bands on your chart, along with breakout reversal early warning and confirmation signals which can be interpreted as buy/sell signals.
- BORCv5 utilizes multi-period Bollinger Bands & custom signals to paint a clear picture of price movement.
- BORCv5 works on everything: Futures, Equities, Indices, Crypto, and on any time interval.
The purple line represents the simple moving average (SMA) for the period (default: 20). You can use the EMA instead if you prefer via settings.
The Bollinger bands & trend lines tell you if the stock is trading "high" or "low" relative to its recent price action.
- The inner green/orange/red bands represent short term Bollinger Bands: 1 Standard Deviation (SD), 2SD, 3SD and 4SD
- The grey bands represent intermediate term Bollinger Bands.
The width of the bands changes due to volatility. Narrow Bollinger Bands represent low volatility, where price is relatively flat or trending slowly in one direction. Wide open Bollinger Bands signify either high volatility OR trending powerfully in one direction. If the Bands are pointing downwards it is a bearish trend and if the Bands are pointing upwards it is a bullish trend.
It is important to get the right amount of data (or context) for Bollinger Bands: Too small of a period for basis (5,8,10) and you won't have enough data (or context). Too high of a period and you will have too much data (or context). The right amount of data (or context) is also important because you want to follow averages that algos & other traders follow and you want the Bollinger length to give you enough data to see various standard deviations. Too low of a Bollinger length means the bands deform too easy & too high of a Bollinger length means they are too flat, making the data hard to interpret. We like 20 periods as a compromise between not enough & too much data but you can adjust this value in the script settings.
Breakout Reversal Confirmation Signals:
Pay attention to the triangles: they represent the price movement action of the larger period Bollinger Band that will filter out most of the false breakouts.
Triangles pop up when the price breaches the 2.9 standard deviation, meaning we're in an extreme range leading to a continuation or reversal.
Red Triangle:
- Pointing Down => Bearish Breakout has occurred, watch for a Bullish Reversal
- Pointing Up => Bullish Breakout has occurred, watch for a Bearish Reversal
Green Triangle:
- Pointing Down => Bearish Reversal is confirmed, price has a high chance to move Bearish
- Pointing Up => Bullish Reversal is confirmed, price has a high chance to move Bullish
Red Circle:
- Weak Bearish / Bullish Breakout
Green Circle:
- Weak Bearish / Bullish Reversal Confirmed
For more information, see the BORC PDF guide and examples!
PS: This script was originally published by reaganmcf and has been upgraded to Pine v5.
초대 전용 스크립트
이 스크립트는 작성자가 승인한 사용자만 접근할 수 있습니다. 사용하려면 요청 후 승인을 받아야 하며, 일반적으로 결제 후에 허가가 부여됩니다. 자세한 내용은 아래 작성자의 안내를 따르거나 philamerica에게 직접 문의하세요.
트레이딩뷰는 스크립트의 작동 방식을 충분히 이해하고 작성자를 완전히 신뢰하지 않는 이상, 해당 스크립트에 비용을 지불하거나 사용하는 것을 권장하지 않습니다. 커뮤니티 스크립트에서 무료 오픈소스 대안을 찾아보실 수도 있습니다.
작성자 지시 사항
Send a DM here (philamerica) or @philanywhere on Twitter for access to the script.
면책사항
해당 정보와 게시물은 금융, 투자, 트레이딩 또는 기타 유형의 조언이나 권장 사항으로 간주되지 않으며, 트레이딩뷰에서 제공하거나 보증하는 것이 아닙니다. 자세한 내용은 이용 약관을 참조하세요.