PROTECTED SOURCE SCRIPT
업데이트됨 Configurable Yield Curve
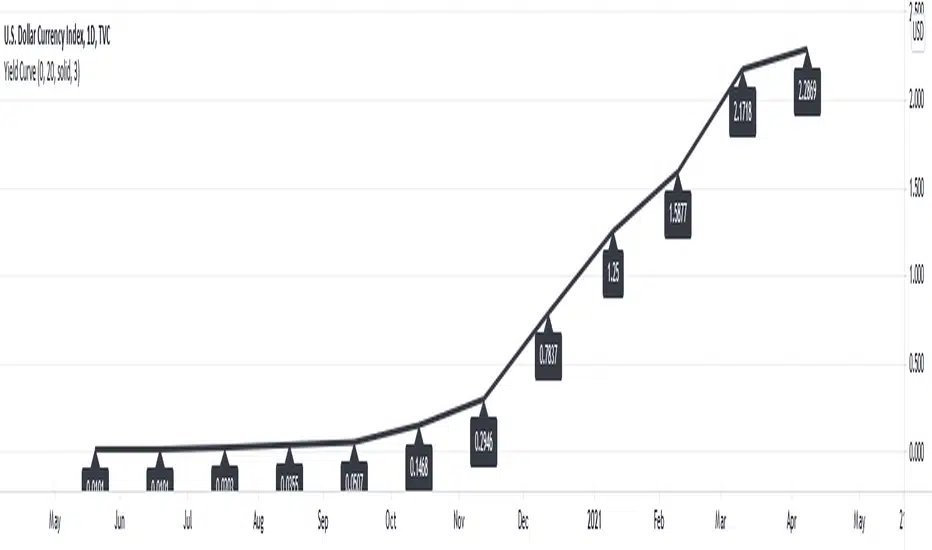
This script draws the US Yield Curve (one month to 30 years). It can be configured to show earlier values using the "Yield values from x bars before" parameter. A value of five and chart time zone "1 day" will show the Yield Curve as it was five days ago. In addition, style settings of the Yield Curve line and the labels can be configured. The drawing engine is also optimized to reduce local and server-side computations.
릴리즈 노트
Added configuration options to include/exclude segments of the yield curve.보호된 스크립트입니다
이 스크립트는 비공개 소스로 게시됩니다. 하지만 이를 자유롭게 제한 없이 사용할 수 있습니다 – 자세한 내용은 여기에서 확인하세요.
면책사항
해당 정보와 게시물은 금융, 투자, 트레이딩 또는 기타 유형의 조언이나 권장 사항으로 간주되지 않으며, 트레이딩뷰에서 제공하거나 보증하는 것이 아닙니다. 자세한 내용은 이용 약관을 참조하세요.
보호된 스크립트입니다
이 스크립트는 비공개 소스로 게시됩니다. 하지만 이를 자유롭게 제한 없이 사용할 수 있습니다 – 자세한 내용은 여기에서 확인하세요.
면책사항
해당 정보와 게시물은 금융, 투자, 트레이딩 또는 기타 유형의 조언이나 권장 사항으로 간주되지 않으며, 트레이딩뷰에서 제공하거나 보증하는 것이 아닙니다. 자세한 내용은 이용 약관을 참조하세요.