OPEN-SOURCE SCRIPT
Kill Zone Max Volume Candle Lines
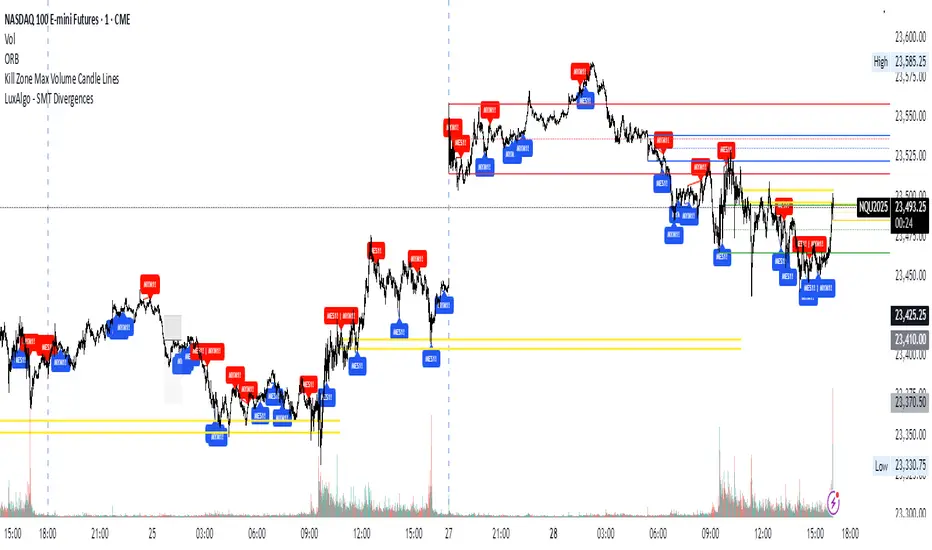
The Kill Zone Max Volume Lines indicator identifies the highest-volume candle within four key market sessions (Asia, London, NY AM, NY PM) and plots horizontal lines at its high, low, and midpoint levels, extended to the right.
Designed for traders targeting zones of heightened activity, this indicator highlights dynamic support and resistance levels based on volume—ideal for breakout or bounce strategies during highly volatile periods known as “kill zones.”
Perfect for indices such as Nasdaq (NQ), S&P 500 (SP), and Dow Jones (YM) on 15-minute or higher timeframes.
오픈 소스 스크립트
진정한 트레이딩뷰 정신에 따라 이 스크립트 작성자는 트레이더가 기능을 검토하고 검증할 수 있도록 오픈소스로 공개했습니다. 작성자에게 찬사를 보냅니다! 무료로 사용할 수 있지만 코드를 다시 게시할 경우 하우스 룰이 적용된다는 점을 기억하세요.
면책사항
이 정보와 게시물은 TradingView에서 제공하거나 보증하는 금융, 투자, 거래 또는 기타 유형의 조언이나 권고 사항을 의미하거나 구성하지 않습니다. 자세한 내용은 이용 약관을 참고하세요.
오픈 소스 스크립트
진정한 트레이딩뷰 정신에 따라 이 스크립트 작성자는 트레이더가 기능을 검토하고 검증할 수 있도록 오픈소스로 공개했습니다. 작성자에게 찬사를 보냅니다! 무료로 사용할 수 있지만 코드를 다시 게시할 경우 하우스 룰이 적용된다는 점을 기억하세요.
면책사항
이 정보와 게시물은 TradingView에서 제공하거나 보증하는 금융, 투자, 거래 또는 기타 유형의 조언이나 권고 사항을 의미하거나 구성하지 않습니다. 자세한 내용은 이용 약관을 참고하세요.